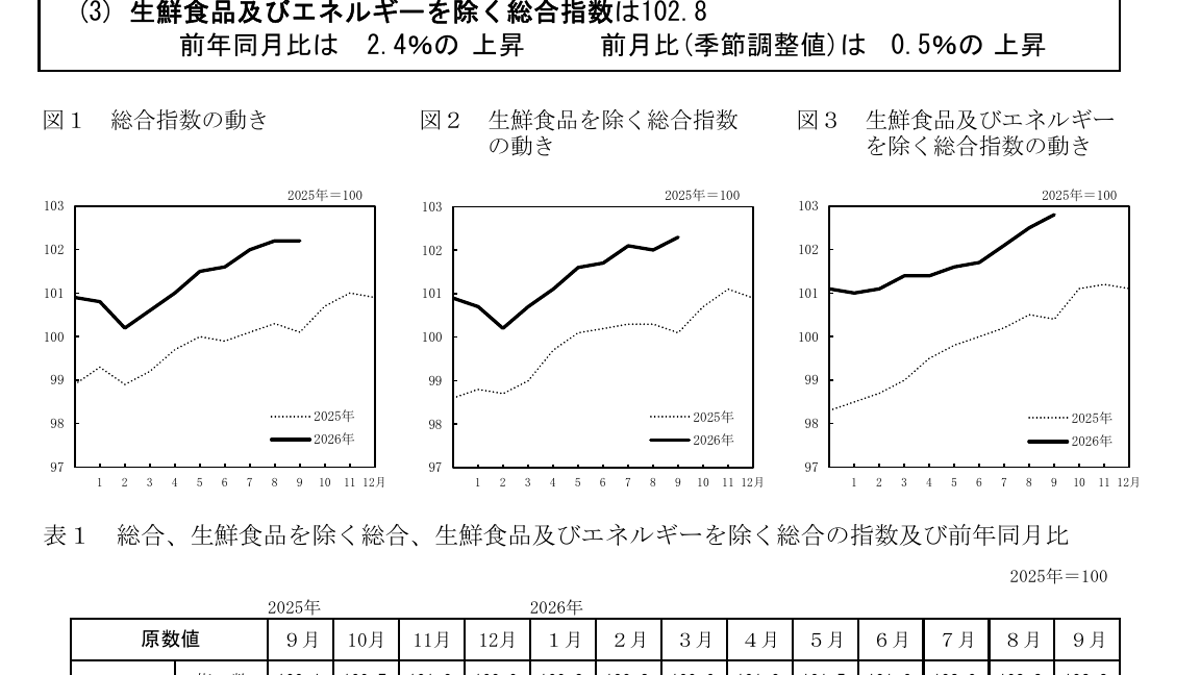


On October 23, the Statistics Bureau of Japan's Ministry of Internal Affairs and Communications released the national consumer price index for September 2026. Using 2025 as the base year of 100, the composite index was 102.2, representing a year-on-year increase of 2.1%; the composite index excluding fresh food was 102.3, also showing a year-on-year increase of 2.1%; and the index excluding both fresh food and energy was 102.8, with a year-on-year increase of 2.4%. Although these three figures appear similar, they answer different questions: the first figure considers all prices included in the basket, the second reduces fluctuations in fresh food prices, and the third further eliminates the impact of energy costs. If one single figure is chosen to describe inflation in Japan, it is easy to overlook these structural differences.
The Japanese market is accustomed to referring to "excluding fresh food" as the core CPI, which is different from the definition used in some other countries, which includes "excluding food and energy." When making cross-country comparisons, the same name does not necessarily mean that the statistical baskets are the same. The data for September provides a more reliable way of interpreting the information: it first clarifies what each index excludes, and then explains what that exclusion can reveal. Especially in months when there are significant changes in energy prices, the differences between the "core" and the "core-core" figures may contain more meaningful information than a single year-on-year figure.
Between 2.1% and 2.4%, what kind of price structure lies within?
The three year-on-year increases announced by the statistical bureau indicate that, excluding fresh food and energy, the price of broad-based goods and services rose by 2.4%, which is higher than the overall index and the index excluding fresh food, which was 2.1%. This cannot be mechanically attributed to a sharp drop in any one commodity, as the index is also affected by changes in weights and other sub-items; for an accurate breakdown of contributions, one would need to refer to the complete monthly report. What is certain is that even after further excluding energy, the year-on-year increase did not disappear, suggesting that price pressures cannot be simplified to a single story related to energy prices. It also does not mean that all services and goods increased in price by 2.4%; the actual expenditure structure of a median household may differ from the statistical weights.
This time, 2025 is used as the base period with a value of 100. Changing the base period mainly affects the index scale and weight updates; therefore, 102.2 should not be interpreted as "a 2.2% increase since some distant year." It merely represents the level relative to the 2025 base period. A year-on-year increase of 2.1%, on the other hand, compares to the same month last year, and the reference frames for these two figures are completely different. After resetting the base period, when comparing cross-year trends, it is also important to consider how the old series connects with the new one. The Bureau of Statistics provides a detailed explanation for the continuation of long-term time series on their results page. When creating charts that span years, it is preferable to use the series that has been officially processed rather than simply piecing together raw data from different base periods.
The Consumer Price Index (CPI) is not a reflection of consumers' subjective feelings about each individual bill. The index measures overall changes based on a fixed set of representative items and their corresponding weights; whether an individual owns a home, uses public transportation, or what foods they purchase can all affect the perceived level of inflation. If the prices of goods that are purchased frequently rise rapidly, even if they account for a small proportion of the official index basket, it may make life feel more expensive than indicated by the overall index. Conversely, subsidies or a decline in energy prices may temporarily lower the overall index, while the prices of certain services continue to rise.
Another easily overlooked aspect is year-over-year (YOY) and month-over-month (MOM) comparisons. A YOY comparison compares September with September of last year, taking into account the cumulative changes over the past 12 months; a MOM comparison only looks at the period from August to September. Without verifying seasonal factors and individual components, it is not appropriate to conclude that prices suddenly accelerated in September based solely on a YOY figure. To confirm whether a trend continues, it is necessary to observe MOM data, service prices, wages, and the transmission of corporate prices over several consecutive months, rather than making overly definitive policy predictions based on a single month's figures.
What to look forward to next for families, businesses, and the Bank of Japan
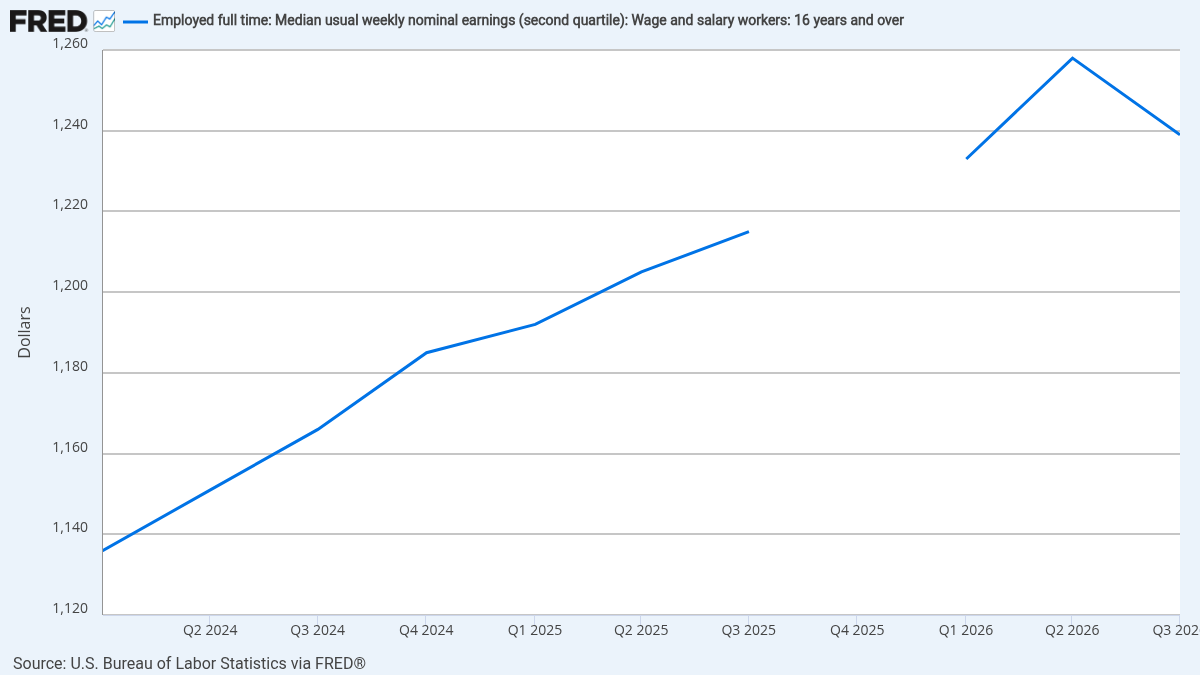
For families, a general inflation rate of 2.1% is the starting point for discussions about purchasing power, not the end point. Actual purchasing power also depends on wage growth, taxes, and the structure of household expenditures. If the increase in nominal wages exceeds the rise in prices faced by families, purchasing power can improve; however, if wages do not keep up, an increase in nominal income may not necessarily offset daily costs. When reporting on prices in Japan, it is important to consider wages alongside consumption to avoid mistaking a "decrease in inflation rate" for "prices returning to their previous levels." A slowdown in year-on-year increases simply indicates that prices are rising more slowly, which usually does not mean that the overall level of prices has decreased.
What enterprises are concerned about is whether they can pass on the costs, and whether customers can afford them. Changes in energy and imported inputs may quickly affect upstream costs, while service prices are more influenced by wages and domestic demand. The sustainability of different price chains varies; it is not possible to determine the profit margins of a catering, manufacturing, or logistics company based solely on the overall index. If investors infer a company's pricing power based on this, they should further verify industry-specific data, sales volumes, and cost figures, rather than directly applying national CPI figures to individual companies.
As for monetary policy, this statistic is one of the materials used by the Bank of Japan to observe the sustainability of prices and is not an independent decision-making command. The central bank also takes into account wage negotiations, demand, inflation expectations, and the overseas environment. In September, the inflation rate after excluding fresh food and energy was 2.4%, indicating that broad price changes are still worth monitoring; however, whether a stable wage-price cycle has formed cannot be determined by a single-month index alone. If the next batch of data shows different trends in individual components, judgments should also be adjusted accordingly.
The most clear conclusion from this release is that in September, Japan’s three main CPI indicators were all higher than in the same month of the previous year, and these differences need to be explained through definition. Rather than labeling 2.1% as “inflation stabilized” or “inflation out of control,” a more valuable approach to reporting news would be to clarify the base period, use year-on-year comparisons, exclude certain items, and follow up with verification indicators. The purpose of price data is to help identify where the changes are coming from and how long they are likely to last; if these steps are skipped, what remains is just a percentage figure that can be cited at will.