

Bitcoin is currently trading at around $80,148, with 9 days left until the U.S. mid-term elections on November 3rd. Historical charts show that Bitcoin has experienced significant declines near previous mid-term election cycles, only to rise to higher levels in the following years.
With Bitcoin having fallen by 4.1% this month, whether history will once again point to a significant rebound after the elections has become a focus of market attention.
Bottom out after the mid-term elections
The chart shows that Bitcoin fell by 71%, 64%, 51%, and 27% in 2010, 2014, 2018, and 2022, respectively.
Ash Crypto also pointed out that Bitcoin tends to hit lows not long after the mid-term election days. In the past four cycles, the lows occurred 33 days after the 2010 elections, 71 days after the 2014 elections, 39 days after the 2018 elections, and 13 days after the 2022 elections.
However, this year's trend pattern is different.
Bitcoin fell to around $57,718 on July 1st, with approximately 125 days remaining until the mid-term elections on November 3rd. This means that, unlike in the previous four cycles, the low point for Bitcoin occurred a long time before the elections.
Historical mid-term election charts show a significant increase
Looking at the monthly chart of Bitcoin, after each of the past mid-term election cycles in the United States, the price of Bitcoin has risen significantly from its previous levels.
In the 2010 cycle, Bitcoin started at around $0.13 and subsequently rose to $1,242.36, representing a gain of over 9,500 times during that period.
During the 2014 period, Bitcoin rose from around $415.36 to $19,600.53, representing an increase of approximately 4,620%. This demonstrates the significant rise in Bitcoin's price compared to its early levels.
During the 2018 period, Bitcoin rose from $6,173.60 to $69,265.75, with a high point that represented an increase of nearly 1,022% from the starting point.
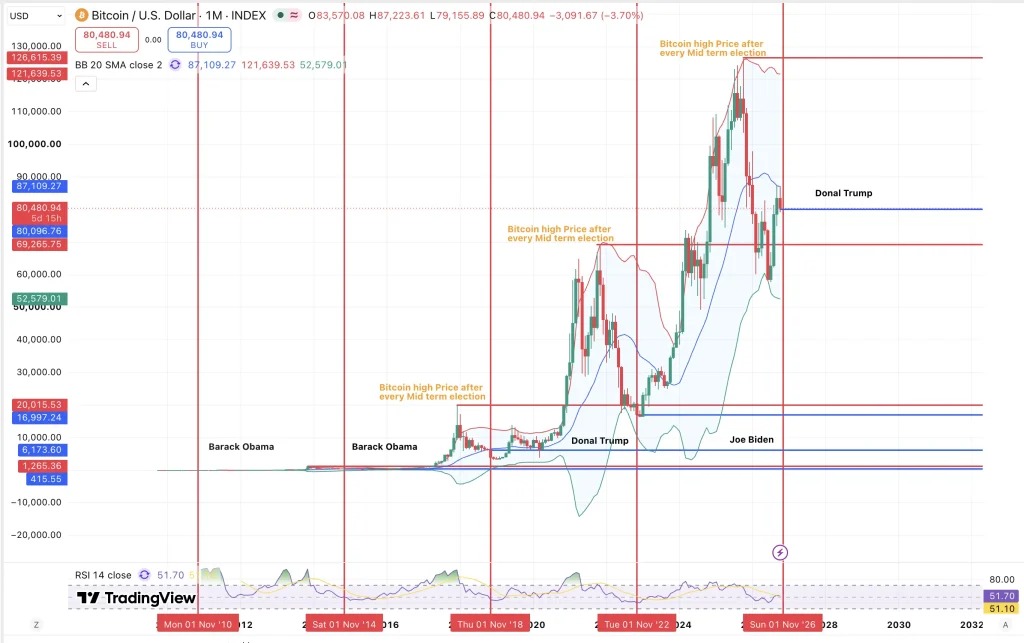
In the 2022 period, Bitcoin started at around $16,997.24 and then rose to $126,615.39, representing an increase of about 645%.
Overall, the chart shows that Bitcoin has risen to higher prices in the years following each mid-term election cycle.
Can Bitcoin repeat its historic rise?
Looking at the monthly chart, Bitcoin is currently around $80,145, which is about 38.8% higher than its low of $57,718 in July. However, since this relatively strong start in October, Bitcoin has still fallen by about 4.1%.
Based on past cycles, Bitcoin could rise to $120,000 not long after the mid-term elections in the United States.