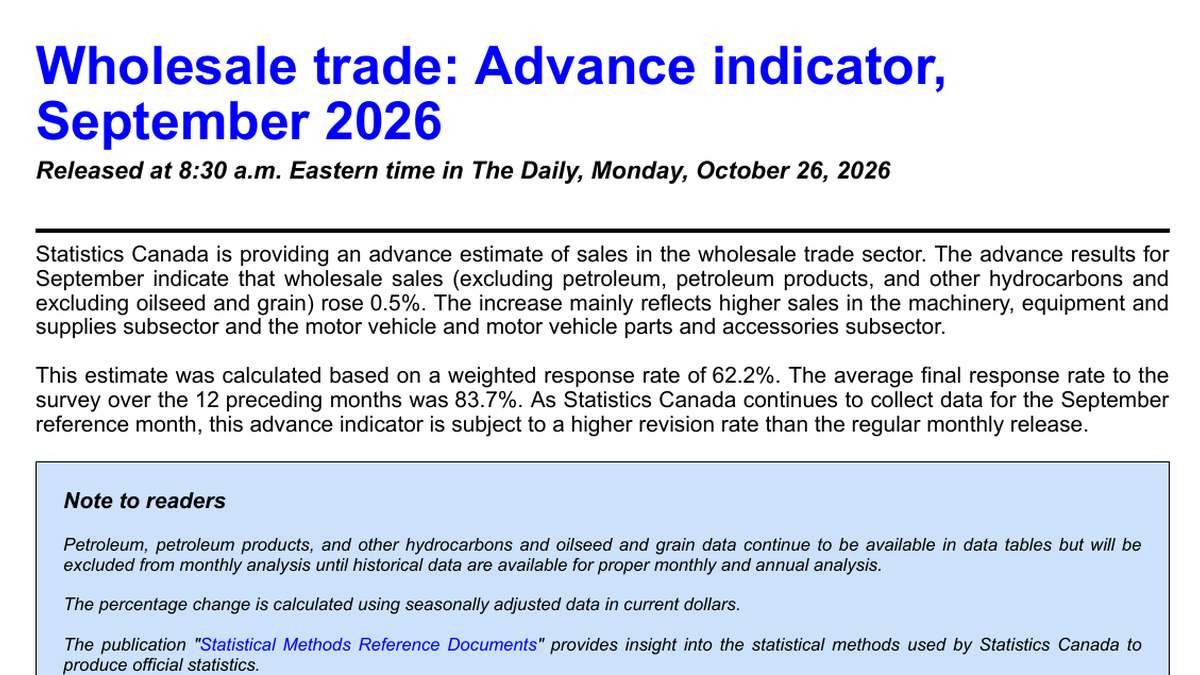


On October 26, Statistics Canada released preliminary indicators for September's wholesale trade: Excluding oil and related hydrocarbons, oilseeds, and grains, wholesale sales were initially estimated to have increased by 0.5% compared to August. The statistical agency noted that sales in the sub-sectors of machinery, equipment, and supplies, as well as motor vehicles and parts, were the main contributors to this growth. This figure provides new insights into the circulation of goods, but it is a preliminary estimate, not the complete monthly final report, nor is it an confirmed actual increase in wholesale volumes. Statistics Canada uses seasonally adjusted current price data, and both price changes and sales volumes can affect the figures. To interpret a “0.5% increase” simply as meaning that all wholesalers sold more goods in physical form would be a misinterpretation of the indicator's meaning.
The value of early indicators lies in their timeliness. Enterprises, logistics providers, and analysts can gain an understanding of the sales trends in major industries without having to wait for all questionnaires to be returned. However, releasing the data ahead of time comes with the cost of uncertainty: Statistics Canada indicates that the weighted response rate for this survey was 62.2%, compared to an average final response rate of 83.7% in the previous 12 months. This difference means that there is still a significant amount of enterprise data that needs to be collected. Officials have also made it clear that early indicators have a higher revision rate than regular monthly reports. If the response rate and the risk of revisions are omitted when reporting on these early indicators, conditional information can be presented as a definite result. Especially with a change as small as 0.5%, subsequent revisions could alter readers' assessments of the strength or weakness of the current month.
Why is it worth focusing on machinery and automobiles separately?
Wholesale of machinery, equipment, and supplies is often associated with corporate investment, equipment renewal, and production activities; wholesale of motor vehicles and parts connects manufacturing, import, distribution, with end-user demand. The simultaneous positive growth in these two sub-industries suggests that there is support from both the investment and consumption chains. However, the statistical bureau only mentioned them as the main driving factors this time, without providing precise growth rates or percentage contributions to the total volume in any advance announcements. Therefore, it is not possible to calculate the extent of increase in corporate capital expenditure based on these announcements, nor can it be said that automobile retail sales have already rebounded accordingly. Wholesale sales are in the midstream of the industrial chain, and the transaction parties and ordering rhythms differ from those of end-consumers. Dealers may adjust their inventories, and manufacturers may change the timing of deliveries, so short-term changes in amounts do not necessarily translate into corresponding changes in retail sales for the same month.
The exclusion criteria also affect interpretation. Data on oil, petroleum products, and other hydrocarbons, as well as data on oilseeds and grains, are still included in the statistical tables. However, Statistics Canada indicates that they will continue to be excluded from regular monthly analyses until appropriate historical monthly and annual analyses can be conducted. This is not to say that there is no economic activity in these related industries, but rather to ensure that the current monthly changes are comparable. If this 0.5% increase is directly compared with other totals that include energy and food, it may lead to confusion in the interpretation of the figures. The Canadian economy is sensitive to the prices of resource commodities and agricultural products, which is why it is even more important to clarify these exclusion criteria. If commodities with large price fluctuations are included or excluded, the overall macroeconomic story of sales figures could be completely different.
In addition, this data uses current prices rather than constant prices. An increase in current price sales can come from an increase in sales volume, a rise in unit prices, or a combination of both. It also cannot be substituted for the Canadian Industrial Product Price Index released a few days ago: one looks at the sales amount of specific wholesale activities, while the other looks at prices from the producer side, covering different enterprises and transaction links. Even if both indicators move in the same direction, it is not possible to establish a simple causal relationship based on that alone. To determine whether the actual circulation of goods has improved, it is necessary to consider subsequent complete wholesale monthly reports, price data, inventory, and transportation information, rather than making conclusions about the overall economy based on a preliminary estimate.
How do leading signals enter into macro-level judgment?
For macro observers, a more reasonable use of this report is to update the direction of 'possibility' rather than to rewrite economic forecasts. The increase in sales amounts for machinery and automobiles indicates that some supply chains exhibited resilience in September; however, the lower response rates suggest that the evidence is still incomplete. Subsequent monthly reports will carry more weight if they confirm growth and show widespread upward trends across multiple sub-industries. If the final growth figures are revised downward, or if positive growth is concentrated in a few high-priced products, the initial impression will need to be corrected. It is also part of the early indicator mechanism for the media to update their reports after the final data is released, rather than an admission that previous reports were necessarily incorrect.
At the corporate level, it is also not appropriate to take the national average as one's own order. Automobile dealers, machinery and equipment suppliers, and other wholesalers face different inventory cycles, import costs, and customer structures. One industry may drive an overall upward trend, while another may remain stable or even experience a decline. The Statistics Bureau has not provided a complete breakdown in this advance announcement, and this blank space should be retained. For readers, what is truly worth remembering is not the mere 0.5%, but three things: it is an advance estimate for September; the scope excludes energy and oilseed grains; machinery and automobiles are the main drivers, and the weighted response rate of 62.2% makes the likelihood of revision higher than that of a regular monthly report. It would be more responsible with the data to wait until the complete data is released before judging whether this indicates a trend of improvement in Canadian commodity circulation.
During the period waiting for the final monthly report, what is most important to avoid is treating preliminary indicators as direct forecasts of interest rates or economic growth. Wholesale sales are just one aspect of economic activity, and what is announced here is the current price amount, not output after excluding price changes. Even if the final figures show positive growth, it is necessary to consider whether inventory increases accordingly, whether sales are concentrated in a few industries, and whether previous months' figures have been revised. If inventory rises faster than sales, it may not mean that companies are restocking to meet end-user demand; only if sales improve broadly and this is subsequently confirmed by retail sales, transportation, and production materials can a more solid judgment be made. The purpose of releasing preliminary figures is to help people raise questions in advance, not to let a single decimal point replace a complete chain of evidence.