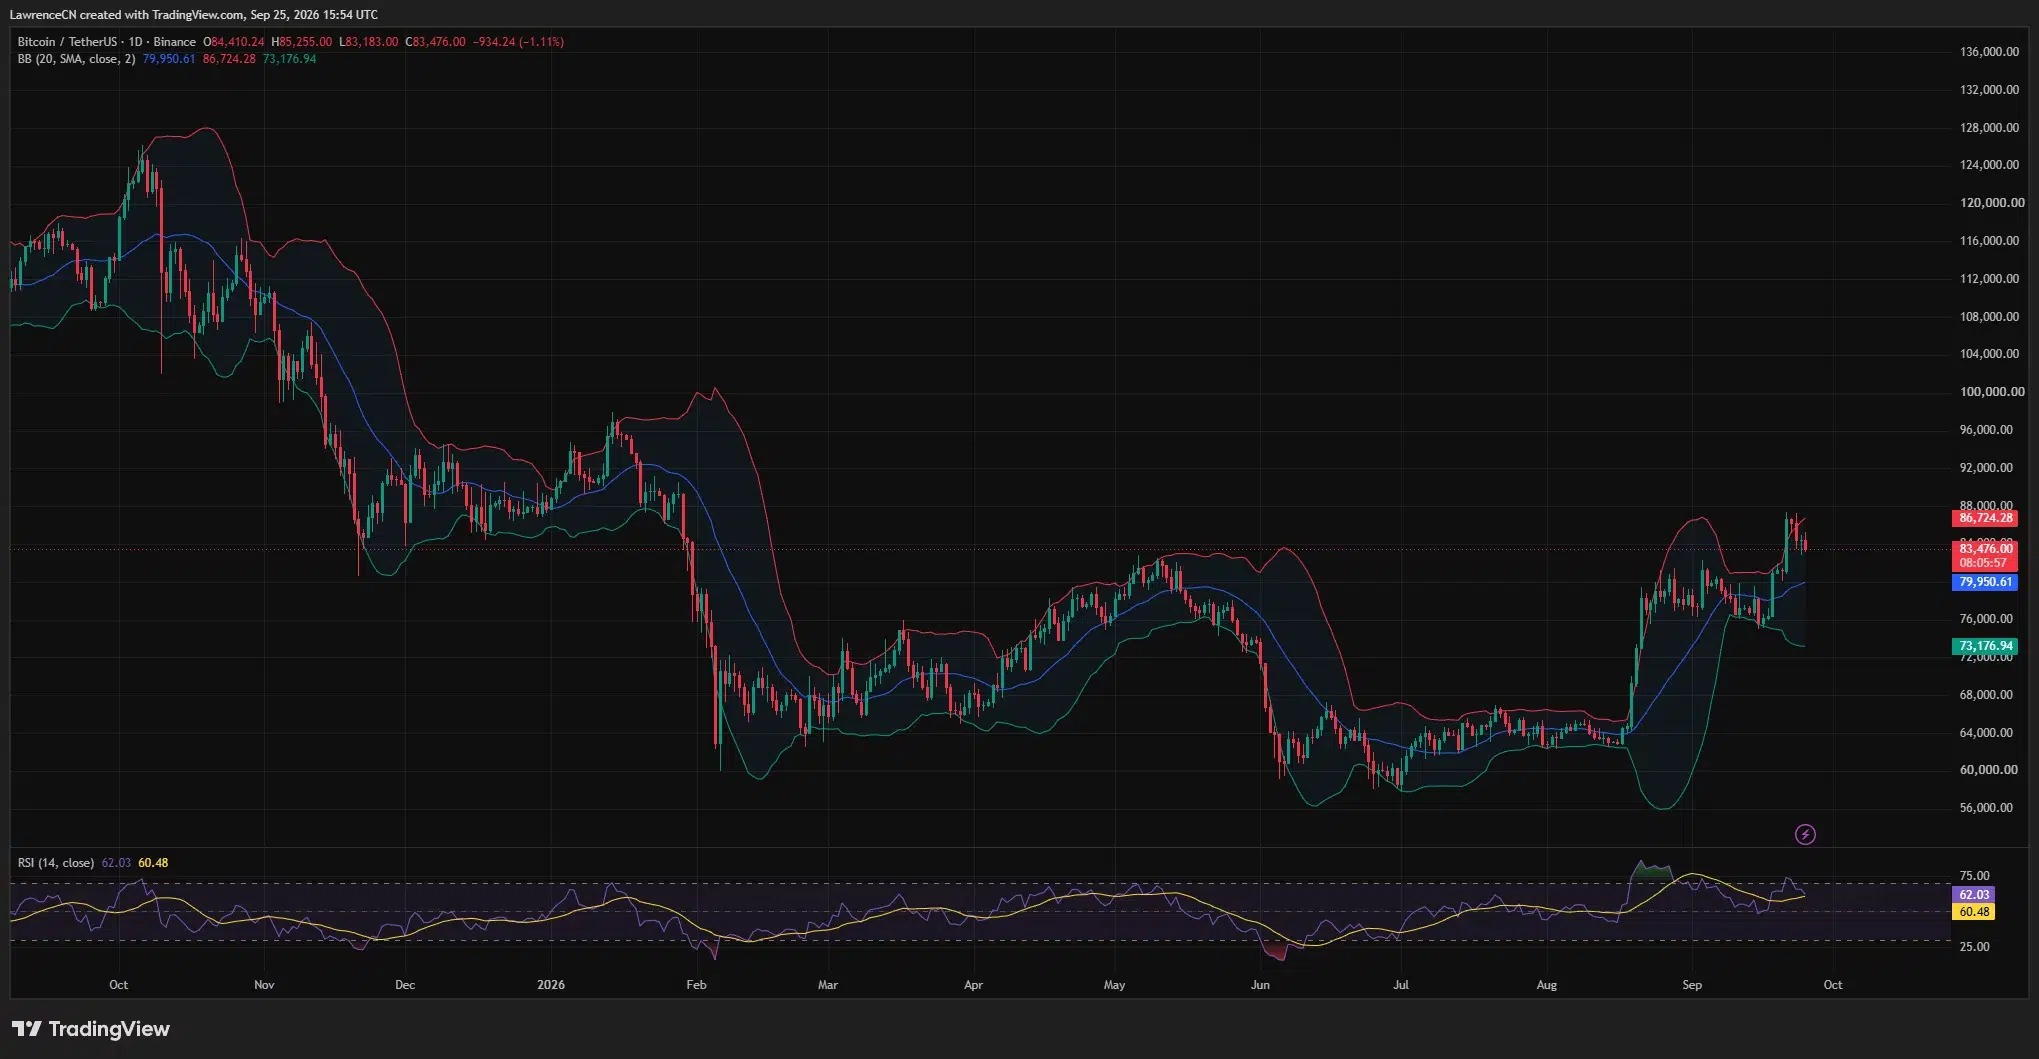


Ethereum prices rebounded above $2,250 on November 1st, up 1.12% from the previous day, approaching $2,270; meanwhile, Bitcoin is nearing $78,000 after a sell-off in the crypto market last week.
After the decline in October, ETH continued to recover, despite the fact that US spot Ethereum ETF has seen capital outflows for five consecutive trading days. CryptoQuant data shows that 43.8 million ETH have been pledged, accounting for approximately 35.9% of Ethereum's circulating supply.
Analysts are focusing on the support level of $2,250 and the resistance level of $2,300, while funding rates indicate an increase in short positions. According to the price data from crypto.news, ETH traded around $2,269.89 on Sunday, with Bitcoin rising by about 0.7% to $77,961. This rebound occurred after the Binance security vulnerability on October 29th, during which the market experienced several difficult trading sessions that pushed Ethereum close to $2,200.
The rise in Ethereum coincided with an overall improvement in the prices of the cryptocurrency market. However, the continuous withdrawal of institutional funds and weak technical indicators suggest that buyers have not yet established a sustainable rebound.
Why is the price of Ethereum still rising at a time when funds are flowing out of ETF?
The incident initially caused cryptocurrency prices to fall, as traders reacted to the theft of approximately $6.3 billion in digital assets.
However, Binance has since begun to resume withdrawals and stated that approximately 95% of the affected assets have been recovered. The exchange pledged to use its own resources to cover the stolen funds.
Although these developments have alleviated some immediate concerns regarding exchanges, Ethereum has not received the same level of support from institutional investment products.
Data from Farside Investors shows that US spot Ethereum ETF recorded a net outflow of $155.7 million on October 30th.
Among them, BlackRock's ETHA led the decline, with $76.6 million flowing out; Grayscale's Ethereum Mini Trust saw $34.1 million flow out, and its ETHE product had another $21.5 million in outflows.
BlackRock’s ETHB recorded outflows of $19.5 million, followed by Fidelity’s FETH with outflows of $3.3 million, and Morgan Stanley’s MSSE with outflows of $700,000.
From October 26th to 30th, Ethereum funds experienced a net outflow for five consecutive trading days, totaling $431.4 million, whereas the outflow during the previous five trading days was $220.7 million.
As reported by crypto.news on October 29th, continuous selling by institutions has previously been putting pressure on ETH.
As institutional selling continues, Ethereum staking reaches record levels
Despite the outflow of funds from ETF, analyst theophiluspep from CryptoQuant stated that Ethereum staking activities continue to grow.
According to the analyst, nearly 43.8 million ETH tokens are locked within Ethereum's consensus layer.
This quantity accounts for approximately 35.9% of the circulating supply, and the network supports around 814,000 active verifiers.
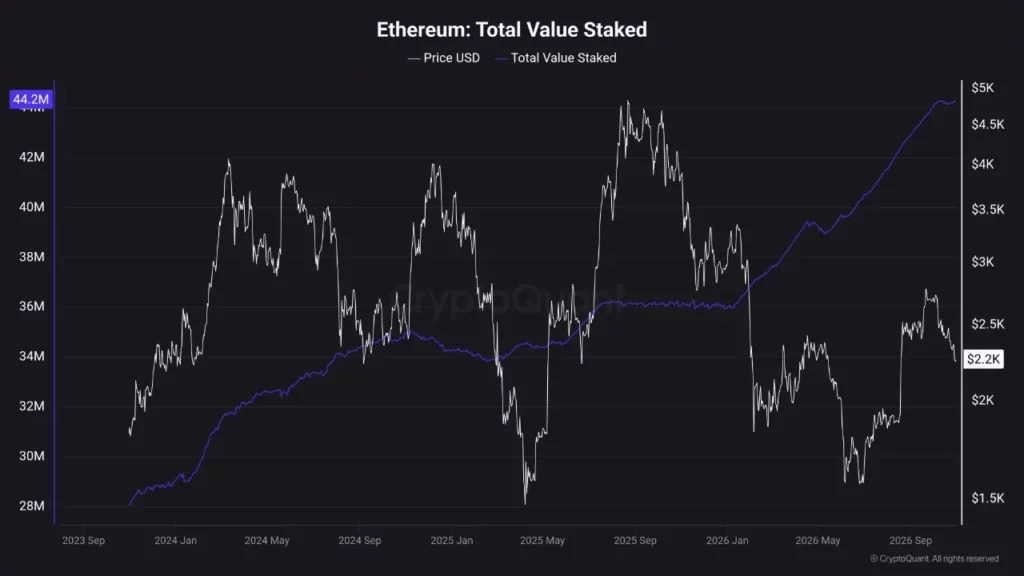
The pledged ETH will continue to be used for network verification until its holder withdraws it through the Ethereum staking process. This continued growth occurs alongside a reduction in exposure by investment funds.
The analyst described this situation as a contrast between the increasing participation in staking and the ongoing redemption of ETF.
However, these data do not prove that the demand for staking led to the price increase on Sunday. They only show that, against the backdrop of institutions selling, ETH continues to enter staking contracts.
Meanwhile, positions in derivatives remain cautiously held. Crypto analyst Ted Pillows indicates that the funding rates for Ethereum have dropped to their lowest level since the market bottom in June.
Negative or abnormally low funding rates usually indicate a stronger short-selling demand, but this does not guarantee that a short squeeze is about to occur.
Ethereum price faces resistance at $2,300
After falling from the $2,750 region in October, Ethereum's daily chart still shows lower highs and lower lows.
Around $2,270, ETH is still close to the $2,250 support level, and traders consider this an important area for weekly closing prices.
The Relative Strength Index (RSI) is at 34.15, indicating weak momentum, and ETH is close to the commonly watched oversold threshold of 30.
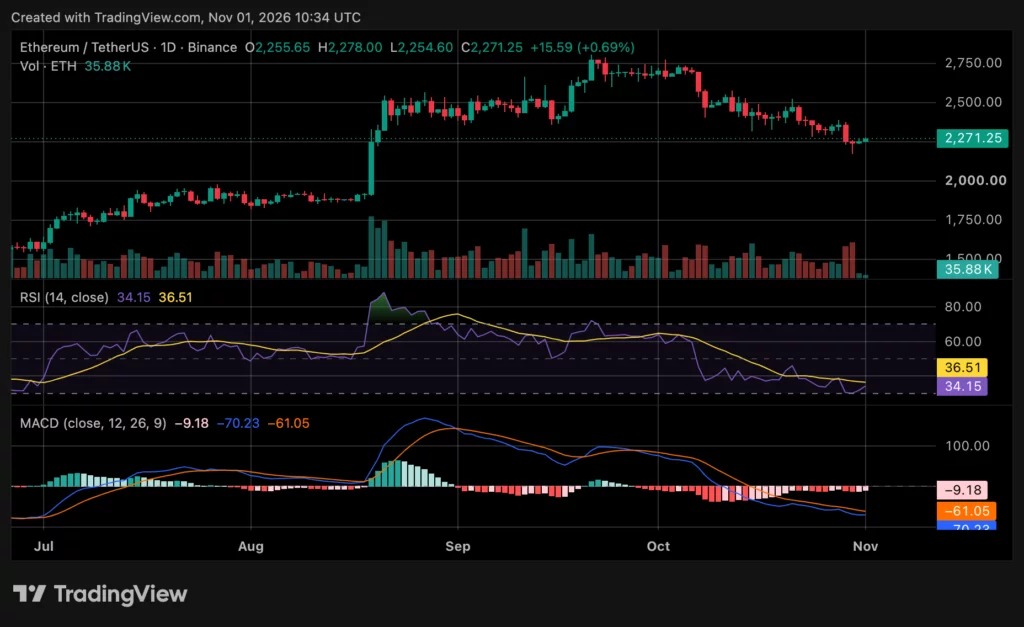
Meanwhile, the MACD indicator remains negative at -70.23, below its signal line of -61.05. The bar chart reading is -9.18, indicating that the bearish momentum may be weakening.
Cryptography analyst Micha ël van de Poppe considers the current price range as a potential buying area and points out that Ethereum has returned near its lowest point since the breakout in August.
He stated that a return to $2,300 would be a bullish signal, but he also acknowledged that if the market fails to recover, prices could fall below $1,850.
In addition, Ted Pillows warns that if the weekly closing price falls below $2,250, it could bring more difficulties to Ethereum's price.
If it can continue to break through $2,300, the market will begin to consider the resistance range of $2,400 to $2,450. If it falls below $2,250, it could then drop to $2,200, followed by the psychological barrier of $2,000.
Traders will also be watching the U.S. employment report released on November 6 for any new economic data that may affect the Federal Reserve's interest rate expectations.
Disclosure: This article does not constitute investment advice. The content and materials provided on this page are for educational purposes only.