

U.S. tech stocks are crashing, but the market appears relatively calm on the surface.
The peak of the Nasdaq 100 index has fallen by about 9%, Intel tumbled 29% in a single day, marking a record decline, and the Philadelphia Semiconductor Index ( SOXX ) has been declining for four consecutive weeks. However, as of last Friday's close, the VIX index, which measures market panic, still did not close above 20.
This contrast is precisely the core contradiction that BTIG Chief Technical Strategist Jonathan Krinsky focuses on analyzing in his latest weekly report "We Are No Longer in Kansas" ( We ' re Not in Kansas Anymore ).
Intense sector rotation remains the main theme of the market. On Thursday and Friday, five sectors saw gains of over 2%, while two sectors experienced declines of over 5%. This means that, despite the chaos in tech stocks, VIX has still not closed above 20 so far.
In other words, when tech stocks were declining, funds did not flee the market; instead, they quickly shifted to defensive sectors such as consumer staples, healthcare, and utilities. The fluctuations at the index level were "hedged" by this rotation, and therefore, VIX remained at a low level.
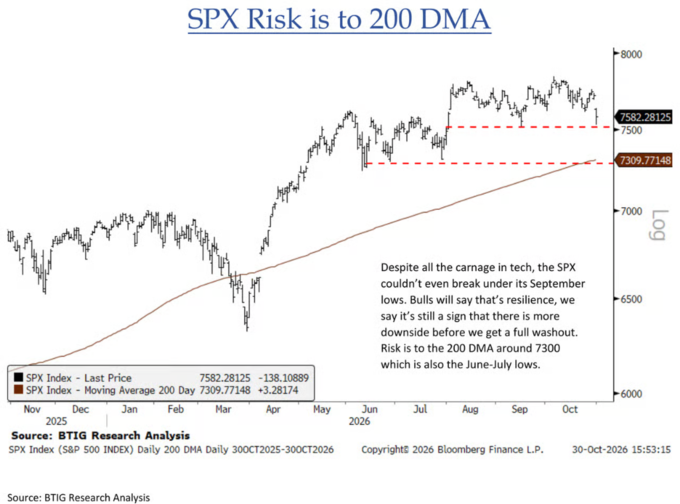
Last Friday was a typical example: the NASDAQ 100 index fell by 2.8% at the opening and around 3.5% at the closing, while the S&P 500 index dropped 138 points to 7,582 points in a single day – yet the S&P 500 did not even break below its September lows. Krinsky is not optimistic about this:
"Bulls would say this is resilience, but we believe that it actually indicates that there is still more room for decline before a true bottom is reached. The risk lies around 7300 points, near the 200-day moving average, which is also the low point from June to July."
There is still a difference of about 3.6% compared to last Friday's closing price of 7,300 points.
Krinsky Warning: None of the real bottom signals have appeared – extreme pessimism among investors, widespread panic selling, or stabilization in the credit market. A systematic cleansing may come after that.
Semiconductors: This doesn't look like a bottom.
Chip stocks were at the center of this round of declines.
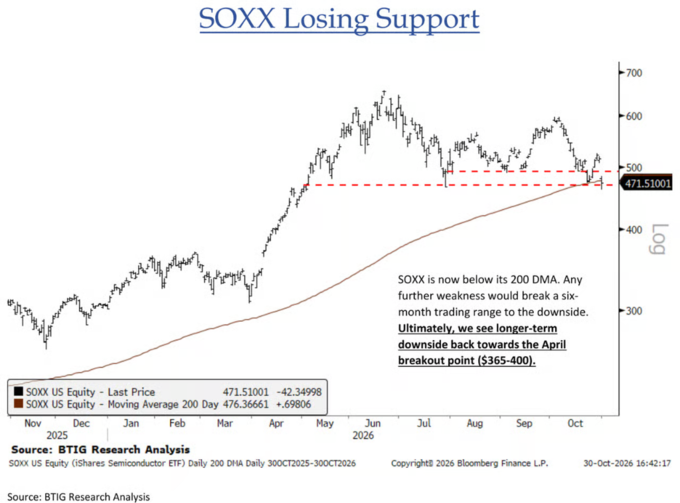
SOXX fell from around $517 at the beginning of Wednesday to $471.51 at the close of last Friday, losing $42 in just one day on Friday, and has now fallen below the 200-day moving average.
Krinsky Judgment:
“SOXX has now fallen below the 200-day moving average. If it continues to weaken, it will break below a six-month consolidation range. In the long term, we expect it to eventually fall back to around the breakout point of April, which is in the $365 to $400 range.”
This means that there is still a potential for a 15% to 23% decline compared to the current price.
The performance of equal-weight semiconductors ETF ( XSD ) is even worse – this is the second time this year that they have fallen below the 200-day moving average, and they are now approaching a third test of the July low. Krinsky directly stated: “This does not look like what a bottom should be like.”
Morgan Stanley’s AI beneficiary stock basket ( MSXXAIB ) is also in trouble; it currently stands at 557, having broken below its multi-month high, while its 200-day moving average is around 598.
High beta/low volatility ratio ( SPHB / SPLV ) – a pure measure of market risk preference – has also fallen below the upward trend it has maintained since this spring.
Nazhi refers to the "bearish pattern on the monthly chart": What does history have to say?
The monthly chart for October sent out a technical signal that deserves attention: after reaching a record high in October, the NASDAQ 100 index ultimately closed below its lowest point from September – a pattern known in technical analysis as a “bearish divergence on the monthly chart.” This is the first time such a pattern has appeared near a historical high since September 2021, which coincides with the weeks preceding the start of the bear market in 2022.
Tracing back to 1985 with Krinsky, 7 similar cases were found, and the conclusion is a mixed bag:
For the bulls, the good news is that in the previous 7 instances of this pattern appearing, the market has recorded positive returns six months later. The bad news is that in each of these 7 cases, there was at least an 8.5% maximum drawdown within the following six months, and in two of them (1990 and 2020), the drawdown exceeded 20%.
Data from BTIG shows that after six months, the NASDAQ index rose by an average of 14.6% (median 11.7%), but during this period, the average maximum drawdown was 14.9% (median 13.1%). The largest single drawdown occurred in 1990, reaching 27.2%.
In the words of Krinsky, history tells us that you may eventually make money, but before that, you'll have to take a punch first.
The real bottom hasn't arrived yet: none of the three signals have appeared.
Why does Krinsky believe that the market has not yet hit bottom? Because none of the three signals that are usually expected to appear before a bottom have appeared yet.
Firstly, the sentiment is not pessimistic enough.
The Nasdaq Daily Sentiment Index closed at 44, the lowest level since July. Sounds low? But it’s worth noting that in July, this index fell to 30, and in March of this year, it even dropped to 12.
Secondly, there has not been a 'full-scale panic day' in the past year.
Krinsky has pointed out a rare phenomenon:
"Despite the chaos in the technology and AI sectors, the continuous rotation of sectors means that in the past year, there has not been a single trading day on the New York Stock Exchange where the volume of declines accounted for more than 80%... We believe that we need to see such a situation at least once, or even several times, before we would consider taking a proactive long position."
Thirdly, the credit market has begun to issue warnings.
The yield spread of investment-grade tech bonds is approaching its highest level of 2022. The average yield spread for high-yield bonds (junk bonds) has risen to 340 basis points, the highest of the year and also the widest since the spring of 2025.
Krinsky put it very directly:
For a while, the weakening of the credit market was 'only' a problem for bonds rated CCC, which are essentially the worst of the worst. But now, the spread on average high-yield bonds has reached its highest level of the year... Problems always start with the lowest quality assets and then gradually spread upwards.
Defense sector: Even safe places are no longer safe.
The destinations of capital rotation are now also beginning to cause concern.
The consumer staples sector saw a gain of over 11% in October, achieving the best single-month performance since the peak of the internet bubble in October 2000. The derivatives team at Bank of America had previously issued a warning, stating that the consumer staples and healthcare sectors had been pushed into a bubble-risk zone, with the last time such a situation occurred being at the peak of the internet bubble.
The situation in the healthcare sector (XLV) is particularly awkward – XLV is currently 16.5% above the 200-day moving average, nearly matching the historical maximum deviation. Krinsky has pointed out a dilemma:
"Yes, it could continue to rise like in 2013, but we believe that whether there is a sell-off due to correlation normalization or a reversal in rotation driven by a rebound in the AI sector, the healthcare sector could become the target of such sell-offs."
After a 11% rebound, the utilities sector has reached a key resistance level. The judgment from Krinsky is: 'The risk-reward ratio has completely changed.'
Gold is no longer considered a safe haven either. The gold price has fallen below its summer lows, and Krinsky believes this constitutes "a meaningful top formation," with a target price of around $3,500 per ounce, which represents a potential decline of about 10% from last Friday's level of $3,899. Silver is trading at $49, showing a "weaker trend," with downside risks pointing towards $40 per ounce.
After the election: a brief rebound, or a real cleansing?
Krinsky also mentions political factors in this report.
Polymarket Data shows that the probability of the Democratic Party winning a Senate seat in Kansas has risen to 54%, whereas at the end of August, this probability was only around 20%. The last time Kansas "turned blue" in a Senate election was in 1932.
Krinsky clearly states that he does not make judgments about political outcomes and also acknowledges that public opinion surveys and betting markets often make mistakes, but he raised a market issue that is worth noting:
"Theoretically, a 'Democratic sweep' would pose a barrier to data center construction. The question is, to what extent has this expectation already been factored into market pricing?"
For the AI section, the logic of Krinsky is as follows: before the election day, the more AI stock falls, the more thoroughly the negative factors are digested. His operational advice is:
The deeper the semiconductor/ AI falls before Tuesday evening, the more likely we are to close our tactical short positions in the AI sector. It should be noted that we still believe there is significant downside potential for semiconductors, but after four consecutive weeks of declines in SOXX, a counter-trend rebound could occur at any time.
Sell rumors, buy facts, and then sell them again.
After the election, it is entirely possible for chip stocks to experience a brief rebound, and the probability of a rebound would even be higher if the selling pressure continues until the voting day. However, that would just be a rebound, not a bottom.
The baseline expectation for Krinsky is that there will be a tactical rebound in the AI sector before and after the election, followed by a "correlation normalization" sell-off that it has been waiting for since September. By then, VIX is likely to break through 20, and the S&P 500 will test the support of the 200-day moving average around 7300 points.