













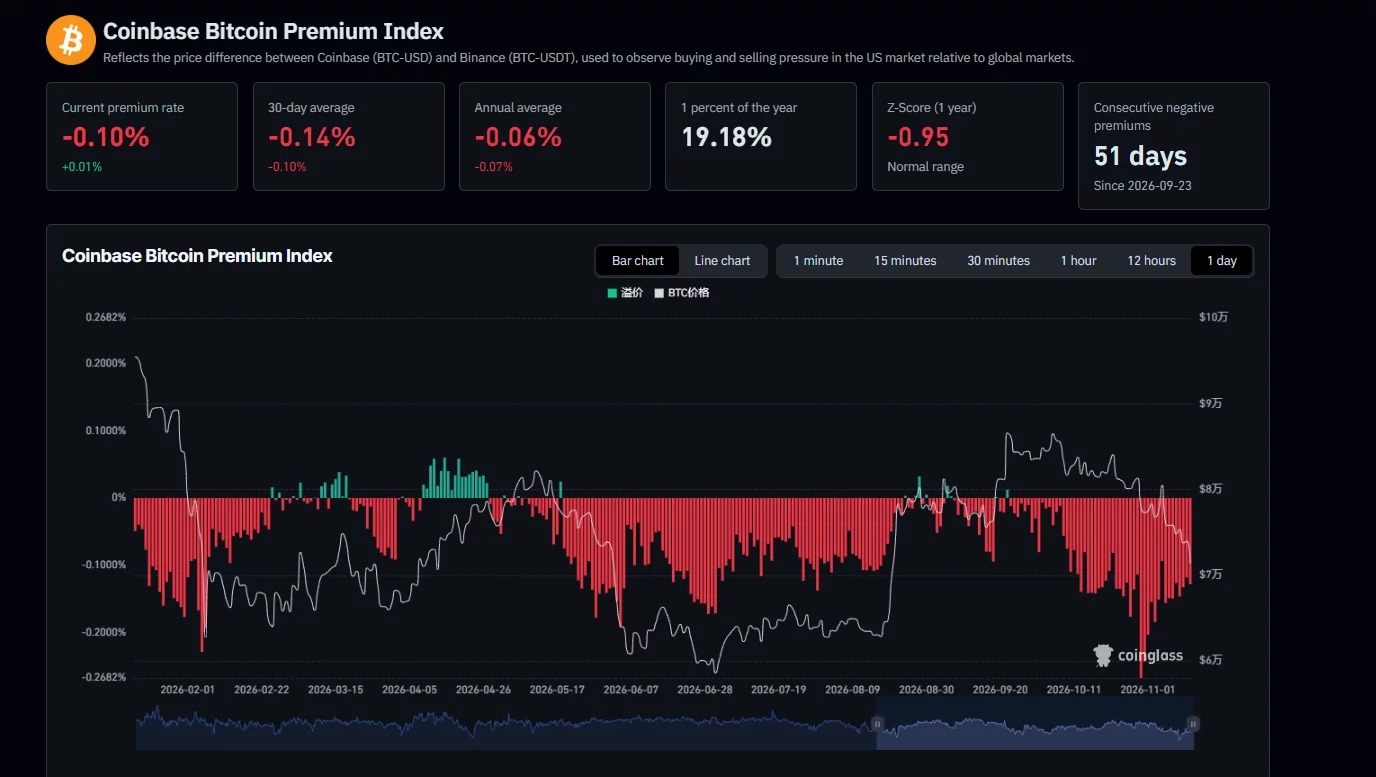
This indicator compares the Bitcoin prices in the BTC-USD market of Coinbase with those in the BTC-USDT market of Binance. CoinGlass describes this indicator as being used to observe the buying and selling pressure in the US market relative to the global market.
The one-year Z-score for CoinGlass is -0.95, and the dashboard labels it as being within the normal range. The duration of the negative premium describes different characteristics of the data: the former counts the consecutive days that are negative, while the latter measures the current reading's position relative to the historical distribution.
Neither the discount percentage nor the duration allows for the identification of the buyers and sellers behind a single transaction. This indicator records the price difference between two markets and does not provide the total amount of dollars flowing into or out of institutional portfolios.
U.S. Bitcoin ETF also recorded capital outflows
During the same period, U.S. investment products also reported capital outflows. As previously reported by crypto.news, as of November 11, spot Bitcoin ETF has seen net outflows for five consecutive trading days, with a total outflow of approximately $1.44 billion during this period.
Morgan Stanley’s Bitcoin Trust attracted $8.96 million in capital inflows, which partially offset the outflows from the aforementioned two funds. According to the same dataset, no other products recorded any net changes on that day.
Despite recent capital outflows, the report indicates that since the launch of these funds in January 2024, the cumulative net inflow has still reached $55.1 billion. The total net asset value is $93.7 billion, of which BlackRock's funds hold $58.71 billion.
The subscription and redemption of ETF measure the capital activities within investment products. The premium of Coinbase reflects the relative pricing between exchanges; neither of these two types of data can reveal the identity or motives of individual investors.
Bitfinex Indicates weak buying interest at delivery and the persistence of leverage.
In an assessment on November 11, analysts from Bitfinex stated that while Bitcoin was declining, spot buying was weak, yet futures positions continued to grow. According to their data, the number of open futures contracts amounted to 701,900 BTC, which represented a 3.3% increase from November 8 to November 11, during a period when prices fell by 2.6%.
After the release of U.S. inflation data, despite a liquidation of approximately $729 million in the market, the number of open contracts only decreased by 0.2%. Bitfinex believes that this limited change indicates that traders re-established their positions almost immediately after their existing ones were closed.
Analysts pointed out that for Bitcoin held for less than 155 days, the average purchase price was $75,717. They estimate that 1.6 million BTC coins purchased in the range of $75,000 to $80,000 are currently at a floating loss, putting recent buyers at risk of incurring losses.
In their view, before the new spot demand returns, holders of the coins may choose to sell when prices rebound close to their purchase price.
Option investors continue to pay for protective positions.
Bitget Wallet Research Previous comments on buying demand stated that a sustained recovery depends on ETF positive capital flow and more balanced derivative positions. Analysts say that this round of selling has eliminated some speculative overheating, but new demand is still insufficient.
des Ligneris indicates: "So far this time, the position has not been held; skewness has risen again, indicating that investors are still paying a higher cost to hedge."