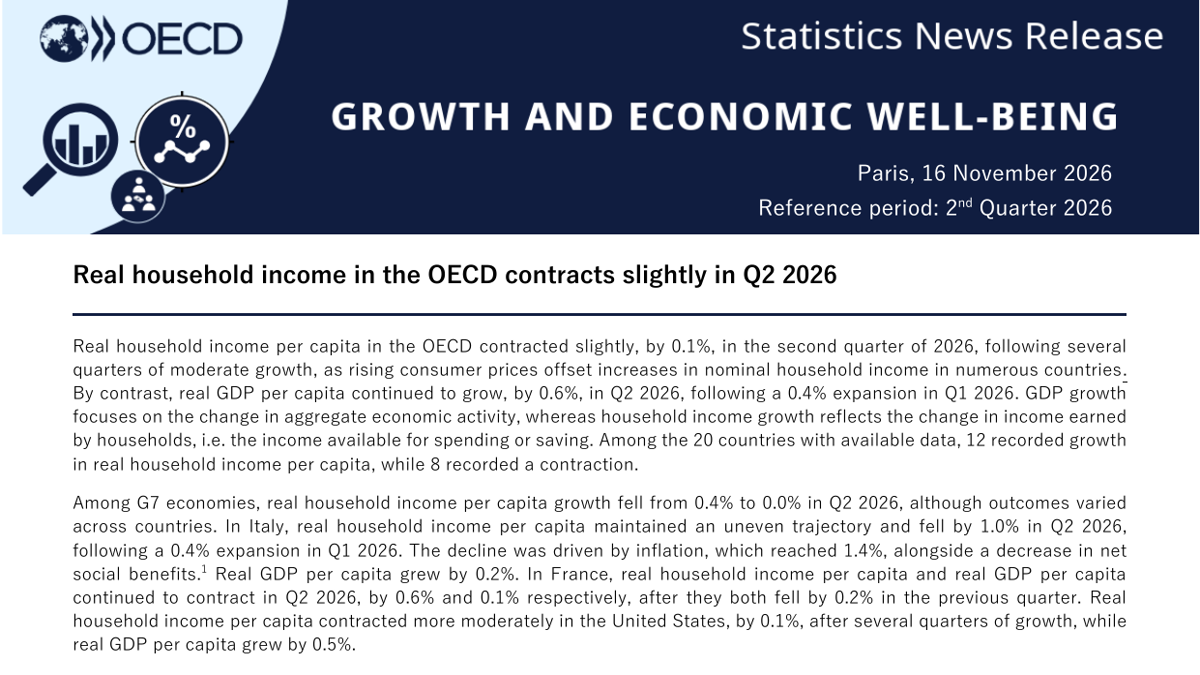











The economy is growing, but there seems to be a bit less money at home. On November 16th, it was announced that in the second quarter of this year, the per capita real GDP of member countries increased by 0.6%, yet per capita real household income actually decreased by 0.1%. OECD
Household income had been growing moderately for several consecutive quarters before turning negative this time; per capita real GDP continued to accelerate after growing by 0.4% in the first quarter. The reason given by OECD is quite simple: in many countries, prices have risen faster than nominal income, and that extra income has been consumed.
Two numerical quantities are not the same.
GDP measures how much the entire economy produces, while household income refers to the money that residents have available to spend or save. When businesses produce more and earn more money, it is first reflected in GDP; for that money to become wages, dividends, and subsidies that go into household accounts, there is a delay, as well as the influence of prices.
The word “actual” is key; it indicates that inflation has been taken into account. For example, if nominal wages increase by 3% and prices rise by 3.5%, then real income actually decreases. Therefore, this set of data reflects purchasing power: in the same quarter, although the economy has grown, ordinary families can afford to buy fewer things.
United States: GDP increases by 0.5%, income decreases by 0.1%
The situation in the United States is almost the same as the overall trend. The per capita actual GDP growth was 0.5%, but after several consecutive quarters of growth, per capita actual household income declined by 0.1%. In other words, the additional output generated in the United States this quarter did not translate into increased purchasing power for its residents.
The overall household income growth rate of the G7 group dropped from 0.4% in the previous quarter to 0.0%. Italy performed the worst, with a decrease of 1.0%. The reason cited by OECD is that inflation reached 1.4%, coupled with a reduction in net social welfare; during the same period, Italy's per capita GDP actually increased by 0.2%. In France, both income and GDP decreased, by 0.6% and 0.1% respectively, and this is already the second consecutive quarter of declines for both indicators, with each dropping by 0.2% in the previous quarter.
There are also cases of growth upwards. Canada saw a growth of 1.5%, the UK grew by 1.0%, and Germany by 0.1%. The UK's growth was driven by an increase in net social welfare, as well as a reduction in income tax and property tax payments; in the previous quarter, it even declined by 0.8%. Germany saw a decline of 0.3% in the previous quarter, and this time it just managed to return to positive territory.
The figures in Canada need to be viewed with a discount. Employee compensation is indeed increasing, especially in industries such as finance, real estate, corporate management, and trade; however, this growth also includes a one-time government payment to subsidize families' expenses for food and necessities. Since it's a one-time payment, there won't be such funds available in the next quarter.
Eight out of twenty countries are experiencing a decline.
This statistic only covers 20 countries that have quarterly data, and the conclusions cannot be directly applied to the remaining member countries. Among these 20 countries, 12 saw growth, while 8 experienced decline. The country with the highest growth was Poland, with a 2.5% increase, driven by employee compensation and net property income, which was 1.2% higher than the per capita GDP growth rate. The country with the largest decline was Chile, which saw a 3.5% drop due to rising inflation and increased unemployment, despite having experienced a 4.4% growth in the previous quarter. Finland saw a 2.0% decline, while during the same period, the per capita GDP grew by 0.4%.
Chile's economy grew by 4.4% in one quarter and then fell by 3.5% in the next quarter, indicating significant volatility in this indicator over a single quarter. Bonuses, subsidies, and one-time payments can all cause such fluctuations. It's not valid to use just 0.1% from one quarter to predict the overall annual trend.
What does this have to do with your position?
People who buy US stocks are accustomed to using GDP to judge a company's revenue. This set of data reminds the other half of the investors: the income of consumer companies ultimately comes from the purchasing power of families. As output is increasing while family incomes are declining, what should be given more attention in financial reports is discretionary spending, as well as the quality of credit cards and consumer loans. If consumption is being sustained by borrowing, sales figures may seem stable for a while, but bad debts often become apparent one or two quarters later.
In the cryptocurrency circle, things need to be viewed from a different perspective. The money that retail investors bring into the market is the portion that remains after deducting expenses from their family income. OECD This statistic does not account for any buying or selling of crypto assets, so it cannot predict how crypto prices will move; it merely provides a backdrop: in the second quarter, the amount of spare money in residents' hands did not increase along with the economy.
What to watch next
Families can initially draw on their savings to cope, so consumption may not decline immediately. What can verify this is the savings rates, credit card balances, and delinquency rates of various countries, as well as the same statistics from the third quarter.
OECD This time, "economic growth" and "becoming more financially comfortable at home" were separated into two different things. The answer for the second quarter is: the former was achieved, but not the latter.