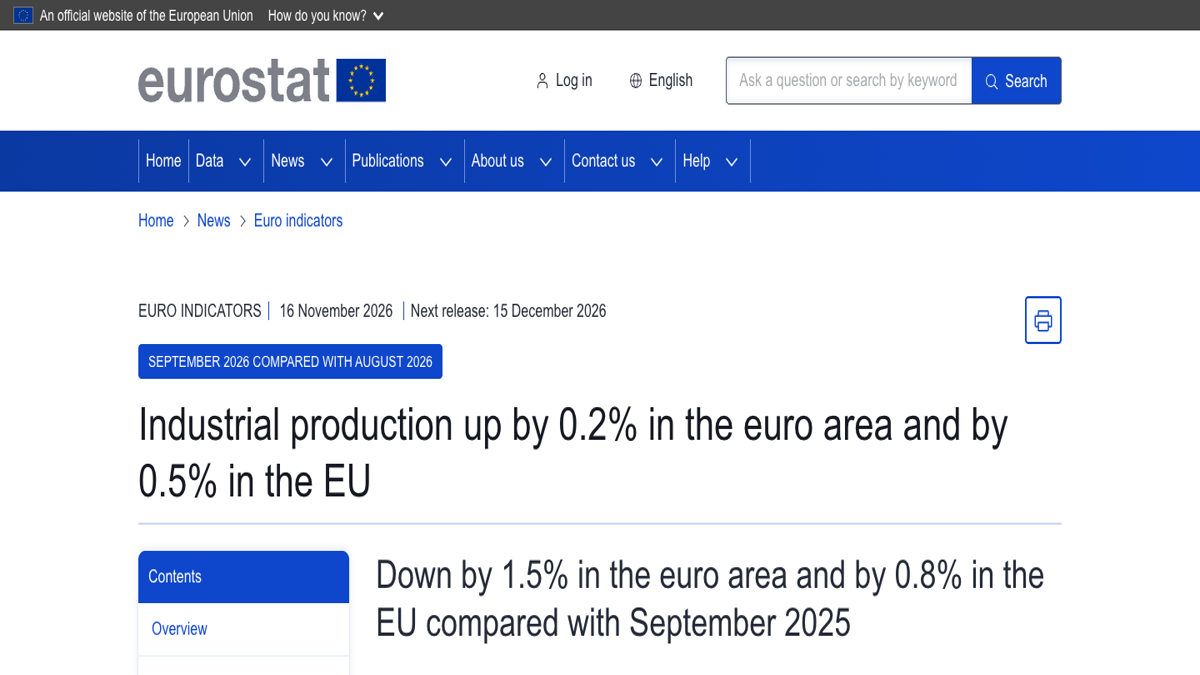











Industrial activity in the eurozone stopped declining in September: production was 0.2% higher than in August. However, compared to September last year, it is still 1.5% lower. In the preliminary figures released on November 16th, both “recovery” and “contraction” are present; interpreting either one alone could lead to misinterpretation. Eurostat
The question being asked is whether there has been an improvement from last month to this month, and whether it has returned to last year's levels. Looking back at the data from Eurostat, the industrial output in the eurozone fell by 0.2% in June, 0.3% in July, and 0.5% in August, showing a decline for three consecutive months. In September, there was a 0.2% increase for the first time in four months, but it still didn't make up for the decline in August alone.
One regularization is the result of five sub-items offsetting against each other.
Among the five major categories in the eurozone, there were two categories that saw increases month-on-month in September: intermediate goods grew by 0.7%, and durable consumer goods grew by 1.3%. Capital goods such as machinery and equipment remained unchanged. There were also two categories that saw declines: energy decreased by 1.7%, and non-durable consumer goods decreased by 0.4%.
When added together, it's only 0.2%. So this figure indicates that some factories are increasing production while others are reducing it; the total is just a little over that. There is still a long way to go before we can say that "European manufacturing has fully recovered."
What held back growth were non-durable consumer goods, which saw a decrease of 7.5% in one year.
Looking at a one-year period, the issues become more pronounced. Intermediate goods, energy, capital goods, and durable consumer goods all showed positive growth, with increases of 0.4%, 0.7%, 0.3%, and 1.6% respectively. Only non-durable consumer goods showed negative growth, with a decline of 7.5%.
Non-durable consumer goods refer to items that are used up once and then discarded, including food, medicines, and daily chemicals. Although the prices of these four categories are rising, the overall trend is negative, mainly due to the impact of this group. As can be seen from the data marked with Eurostat, the prices of these goods fell by 2.8% in both July and August, and then by another 0.4% in September, marking three consecutive months of decline.
Expanding the scope from the eurozone to the entire European Union, the figures look more favorable: there was a month-on-month increase of 0.5% in September and a year-on-year decrease of 0.8%. Non-durable consumer goods in the EU also saw a month-on-month increase of 0.3% in September, with a year-on-year decline of 6.1%, which is lower than the 7.5% in the eurozone. The difference comes from those member states that do not use the euro.
Ireland saw a decline of 19.1% in one year, while the Netherlands experienced an increase of 8.8% in the same period.
The gap between countries is much larger than the average of the eurozone. The country that saw the largest year-on-year decline was Ireland, with a decrease of 19.1%, followed by Bulgaria with a decrease of 8.9% and Romania with a decrease of 6.3%. The countries that saw the largest increases were the Netherlands with a growth of 8.8%, Hungary with 8.2%, and both Lithuania and Malta with 7.1%.
Just looking at September alone, Denmark saw growth of 3.7%, Poland 2.9%, and both the Czech Republic and Slovakia 2.7%; Ireland experienced a decline of 5.5%, Luxembourg 3.8%, and Romania 2.6%. Among the larger countries, Germany grew by 1.3%, Italy by 1.2%, Spain by 0.9%, and France declined by 0.5%.
Ireland's figures are fluctuating significantly every month, with both August and September seeing a decline of 5.5%. In small economies, industrial output is often concentrated in a few large factories, and changes in the production schedules of just one of these factories can influence the national index. Don't rush to conclude that this represents a microcosm of Europe when you see a figure of 19.1%.
For those who hold US stocks, how to use this data?
There are numerous American companies in Europe that generate substantial revenues, spanning industries such as manufacturing, automotive, chemicals, and consumer goods. What this data can help with is to make distinctions: whether a company sells durable goods or everyday necessities, and whether its factories are located in Germany or Ireland, as the environments faced by these companies are quite different. Applying an average figure from the eurozone would blur these two distinctly different situations.
It's also important to note that this metric measures production volume, not sales revenue. Factories may produce more, but if the products are not sold, inventory will increase, and at that point, production volume and demand will diverge temporarily. Rising prices will not boost this indicator either. Therefore, it may show a different trend compared to the revenue figures in a company's financial reports, which are measured in monetary terms.
This data also does not indicate any reaction from the market to it yet. There is not enough evidence to directly link its performance to the daily gains and losses of the euro, European stocks, or crypto assets.
The next one will be available on December 15th.
Eurostat designates these figures as the initial values. The next industrial production data will be released on December 15th, and by then, the figures for September may be revised. A change of 0.1 or 0.2 percentage points is not significant enough to justify declaring that a 'turning point has been reached' so early on.
To determine whether European industry is truly on the mend, just look at two things: whether it can maintain positive growth month after month on a sequential basis, and whether the 1.5% gap compared to the same period last year is narrowing. September provided only the first month of data for the first condition.