

Foreign media analysis suggests that Avalanche's token AVAX has recently rebounded from a low of around $6.10, with a weekly gain of over 3%, and is currently hovering around $6.65. Short-term charts show some recovery in buying power, but the longer-term downtrend structure has not yet reversed.
4-hour chart breakout channel
The article states that AVAX has broken upwards from its previous descending channel on the 4-hour chart, ending weeks of lower lows and higher highs. The increased trading volume during the breakout indicates that this upward movement is not a weak rebound.
Meanwhile, the Supertrend indicator has turned bullish, and the MACD has also shown a bullish crossover, with the histogram entering positive territory, indicating that short-term momentum is strengthening.
Resistance is expected above $6.70.
However, the price is currently testing resistance in the $6.70 to $6.80 range. A break above this area could target $7.20; if buying continues, $8.00 will be a key level to watch.
If AVAX fails to hold the breakout range, the price may fall back to around $6.30. The article argues that this level corresponds to the upper edge of the previous channel, and if it can stabilize after a pullback, the short-term structure can still be considered intact.
- Short-term resistance: $6.70 to $6.80
- Short-term targets: $7.20, $8.00
- Short-term support: $6.30
$10.20 remains a key level on the weekly chart.
Compared to short-term improvements, the weekly chart provides a more cautious signal. The article points out that AVAX is still operating within a long-term downward channel formed since the end of 2025, and the overall market structure has not yet strengthened.
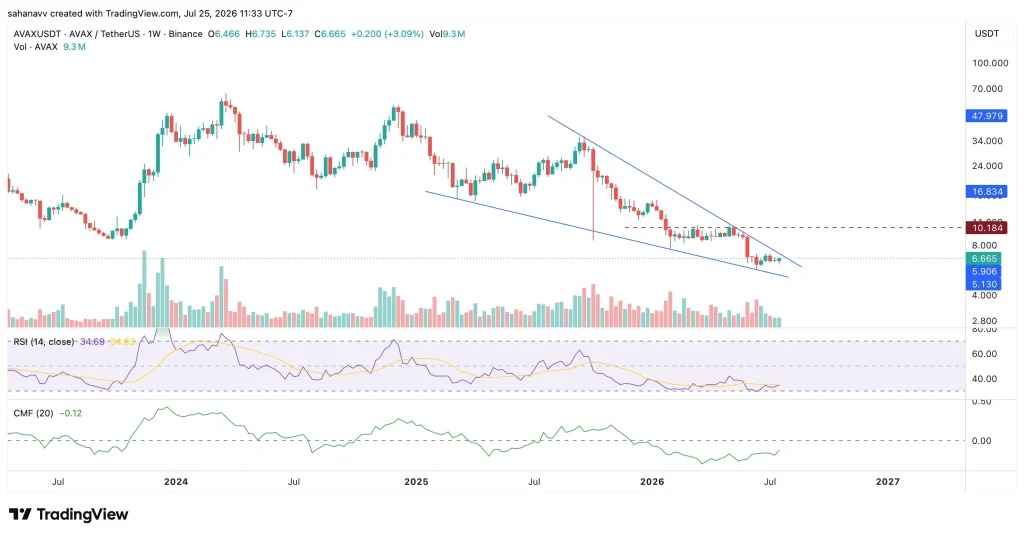
The weekly RSI remains below 40, indicating that medium- to long-term momentum remains weak. The Chaikin Money Flow is also still in negative territory, showing that capital inflows are not yet significant and large-scale buying pressure remains limited.
The article argues that for AVAX to improve its weekly outlook, it needs to first recover the upper edge of its long-term descending channel, and then break through the $10.20 resistance level. Only a sustained hold above this level could be considered a signal of a larger-scale trend change.