Air Canada travel seems quite bustling at the end of summer. According to statistics released by Statistics Canada on September 25th, in August 2026, there were approximately 6.1 million passengers undergoing pre-flight security checks at eight major airports, representing a year-on-year increase of 6.1%. Of these, about 3 million passengers traveled on domestic routes, around 1.4 million on cross-border flights to the United States, and about 1.7 million on other international routes. What is more noteworthy is that the number of passengers undergoing security checks for flights to the U.S. has seen a rebound for the first time after 18 consecutive months of decline, with an increase of 5.9%. However, if we extend the time frame to August 2024, this portion of passenger traffic is still 5.9% lower. The so-called “rebound” is not yet considered a “full recovery.”
This monthly statistic is not the same as the tourism expenditure for the second quarter that was previously announced. Tourism expenditure measures the consumption of tourists in Canada, while airport security check statistics measure passengers departing from designated checkpoints, including both local residents and foreign visitors, and cannot be directly converted into tourism revenue. Its value lies in the ability to observe travel patterns and hub traffic more frequently, especially after events conclude and as cross-border sentiments change, in terms of the structure of flight routes.
Behind the year-on-year increase is a low base caused by last year's strikes.
The Statistics Bureau clearly reminded that in August 2025, a strike by Canadian Airline flight attendants lasted for nearly four days, resulting in the cancellation of thousands of flights. Therefore, the year-on-year comparison for August 2026 has a low base effect, and the 6.1% increase cannot be entirely attributed to a sudden surge in demand this year. The passenger flow figures in the aviation industry are often influenced by factors such as capacity, ticket prices, flight cancellations, and the processing capabilities of airport security checks. A one-month rebound needs to be viewed within a longer time frame, and in particular, the impact of exceptional events last year on the denominator cannot be ignored.
Cross-border flight routes to the United States best illustrate this issue. In August 2026, there were approximately 1.4 million passengers, a 5.9% increase from the same month last year, ending 18 months of consecutive year-on-year declines. However, it is still 5.9% lower than in August 2024. In other words, the number of passengers is climbing from a lower level, rather than having returned to the previous normal level. There are also significant differences between airports: Toronto Pearson Airport saw a 13.2% year-on-year increase in passenger traffic to the U.S., Montreal-Trudeau Airport had a 11.7% increase, while Vancouver Airport experienced a 3.4% decline. If Canadian airports are considered as a whole, it becomes easy to overlook the differentiation in passenger sources and flight route combinations between different cities.
Domestic routes remain leading. In August, the number of passengers undergoing security checks on domestic flights was approximately 3 million, a year-on-year increase of 6.8%, marking the seventh consecutive month that this sector has seen the fastest growth. Among the eight major airports, seven saw an increase in domestic passenger traffic, with only Edmonton International Airport showing a decline. This relatively widespread expansion is different from the "first rebound after a low base" observed in the cross-border sector, as it exhibited a more stable coverage rate that month. However, the number of passengers undergoing security checks does not equate to the occupancy rate, nor can it directly infer an improvement in airline profits; operational performance also depends on ticket prices, costs, and available seats.
International flights outside of the United States increased by 5.0%, with approximately 1.7 million more passengers than in the same period last year, representing a growth of over 78,000 passengers. Among them, Toronto Pearson Airport saw an increase of over 47,000 passengers, with a growth rate of 6.4%. In terms of absolute numbers, domestic flights, flights to the United States, and other international flights collectively contributed to the total in August, but the reasons for this growth were not the same: domestic flights continued to expand, flights to the United States were still recovering, while other international flights maintained positive growth. For airport managers, this means that security check schedules, terminal resources, and transfer services cannot be roughly allocated based solely on the overall passenger growth rate.
After the event, the flow of visitors remained strong, but statistical methods should not be misused.
Throughout the three months of summer in 2026, a total of approximately 17.2 million passengers underwent security checks at eight major airports, representing a year-on-year increase of 2.8%. According to Statistics Canada, the World Cup was held in Toronto and Vancouver in June and July, with a total of 13 matches; in August, the number of passengers undergoing security checks at the airports in these two cities increased by 10.2% and 6.7% respectively, which were the strongest monthly increases for that summer. The events may have affected travel plans, and the cities may have gained more exposure due to the events, but since the August data was collected after the matches, it is not appropriate to attribute the entire increase that month solely to fans. Tourism, family visits, business travel, and regular seasonal movements are still all included in this statistics.
Readers should also note that this data only covers the pre-flight security checkpoints at Canada's eight major airports, which are managed by the Transportation Security Agency. It does not include all airports, nor does it account for aircrew and airport staff. Transfer passengers who do not undergo security checks again will not be counted as part of a new security check. This definition differs from the numbers of arriving and departing passengers published by the airports, as well as the number of people boarding and disembarking during annual air transportation activities. Direct comparison of figures from different sources can easily lead to misleading "airport share changes."
From a macroscopic perspective, the August data provide two clues that can be further examined. First, whether the expansion in domestic travel can sustain itself beyond the quieter autumn season, rather than relying solely on the peak during the summer vacation period; second, whether air routes to the United States will continue to recover after the effect of a low base fades and truly exceed the levels of the same month in 2024. What is certain at this point is that the number of passengers undergoing security checks at the eight major airports remained on the rise at the end of the summer; what is uncertain, however, is whether this growth will continue at the same pace, nor can we directly judge the strength of Canada's entire tourism economy from these security check statistics. Separating rebounds from full recoveries is the most valuable way to interpret this set of data.
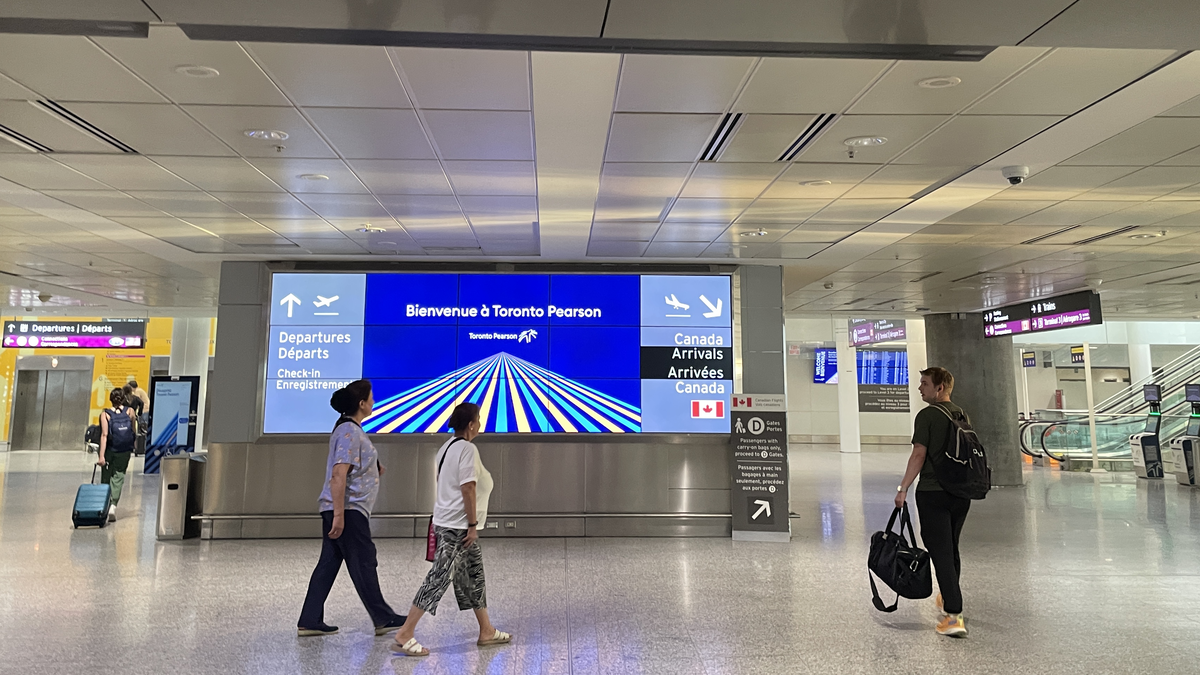
Cover photography by: Uigimi no Kimi / [ Wikimedia Commons ] ( https :// commons.wikimedia.org / wiki / File : Toronto_Pearson_International_Airport_Terminal_1_Toronto_July_2,2026_202607022001_IMG_6294. jpg ), [ CC BY - SA 4.0 ] ( https :// creativecommons.org / licenses / by-sa /4.0__ ). The image has been cropped to a 16:9 ratio from the original photo.