

Chainlink The price is testing the resistance level of $15.32, and although the bullish momentum is strengthening, there are concerns due to a decline in the number of active users.
If it can remain above $15.32, the price could open up space for higher targets of $16 to $18; if it encounters resistance and falls back, the price might return to around $13.
After a strong rebound from a low near $7, the price is currently testing a key resistance zone. The current price is around $15.29, with a 8.25% increase over the past 24 hours and a 200% increase in trading volume. This rise occurred after Chainlink launched CCIP 2.0, which added security, compliance, and cross-chain settlement features for institutions. The participants include AWS, ANZ, Fidelity International, SBI Digital Markets, Sygnum, and Taurus.
However, this breakthrough is facing an important test, as online activity has weakened. This raises a key question: Can the price of LINK continue to rise?
Active addresses are declining, despite the rebound in the price of LINK.
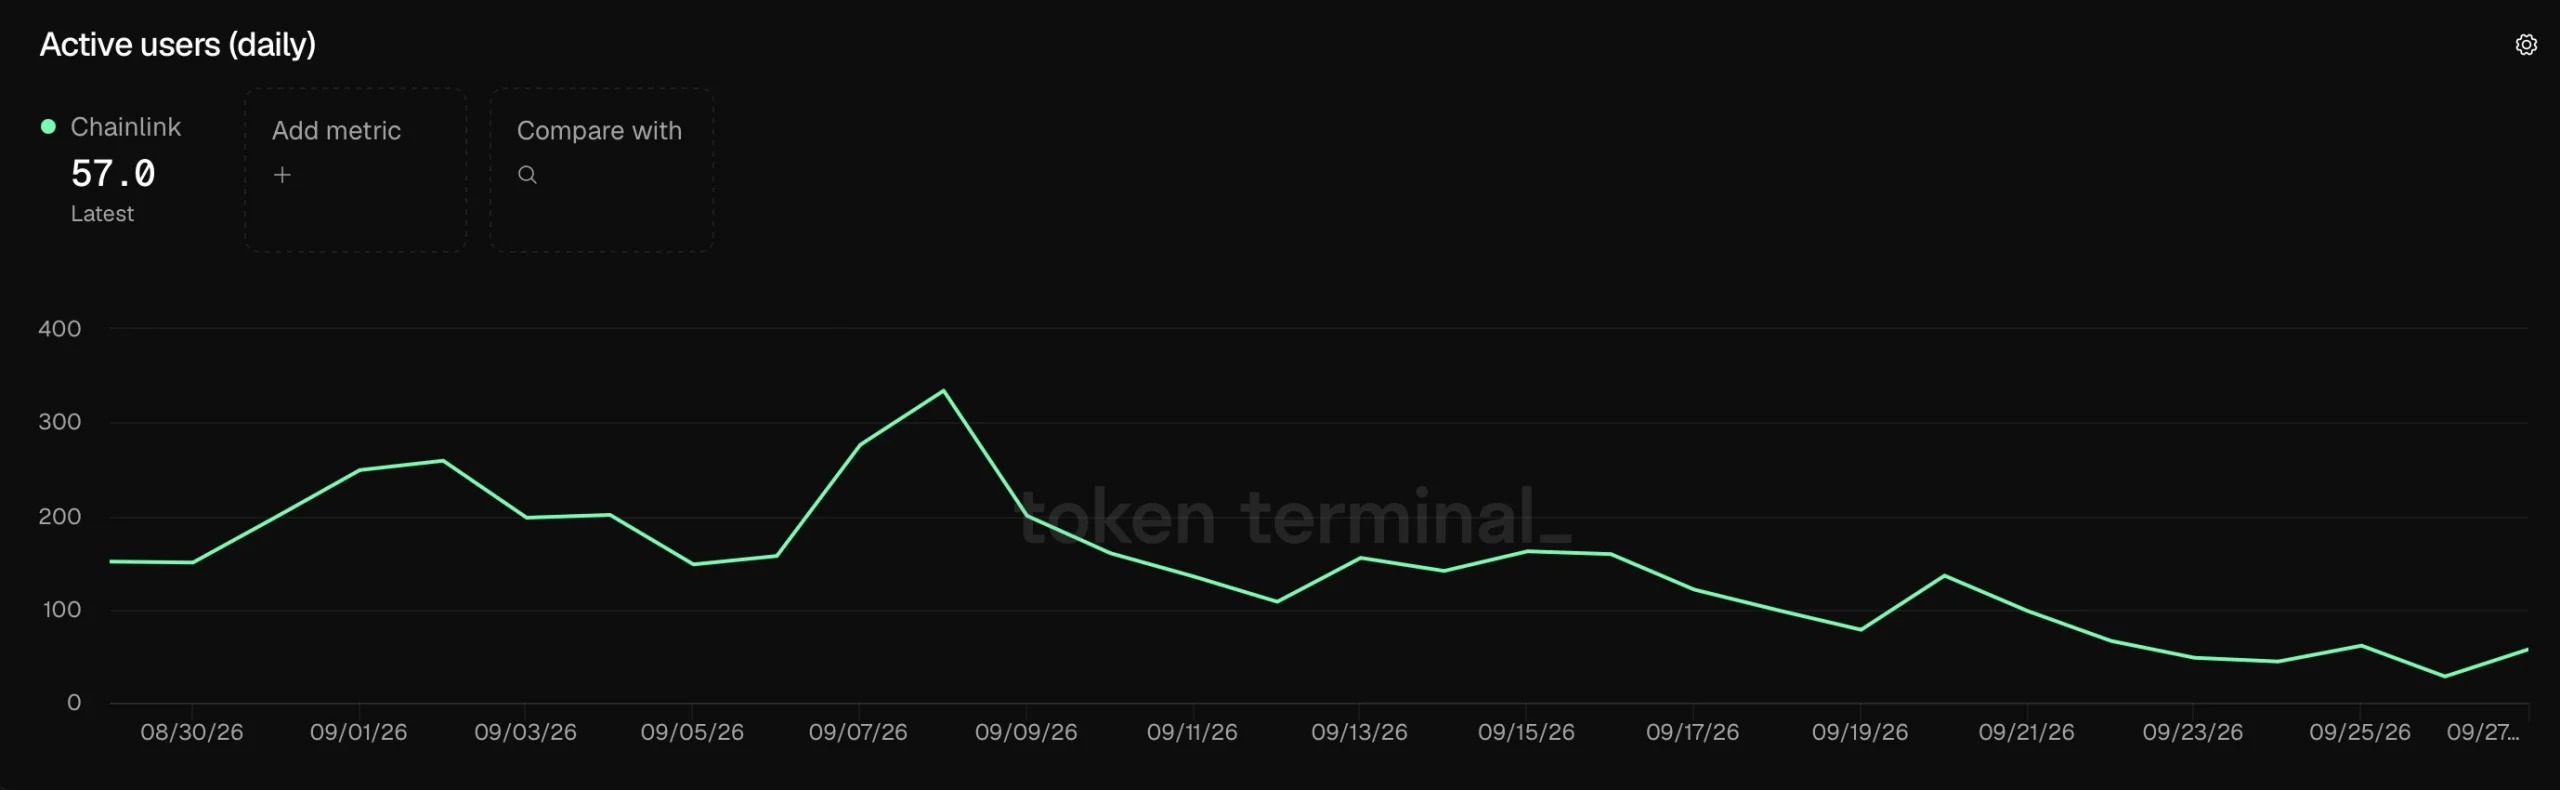
The daily active users of Chainlink have significantly declined, from over 300 to just 57. This decline is noteworthy as the trend of LINK is the opposite, rising from below $9 to above $15. This divergence indicates that the recent price recovery has not been accompanied by a corresponding increase in daily online activity.
However, this decline does not necessarily negate the bullish price structure, especially since the current catalysts are increasingly focused on institutional infrastructure rather than retail network activity.
LINK Price Analysis: Bulls Testing Key Resistance
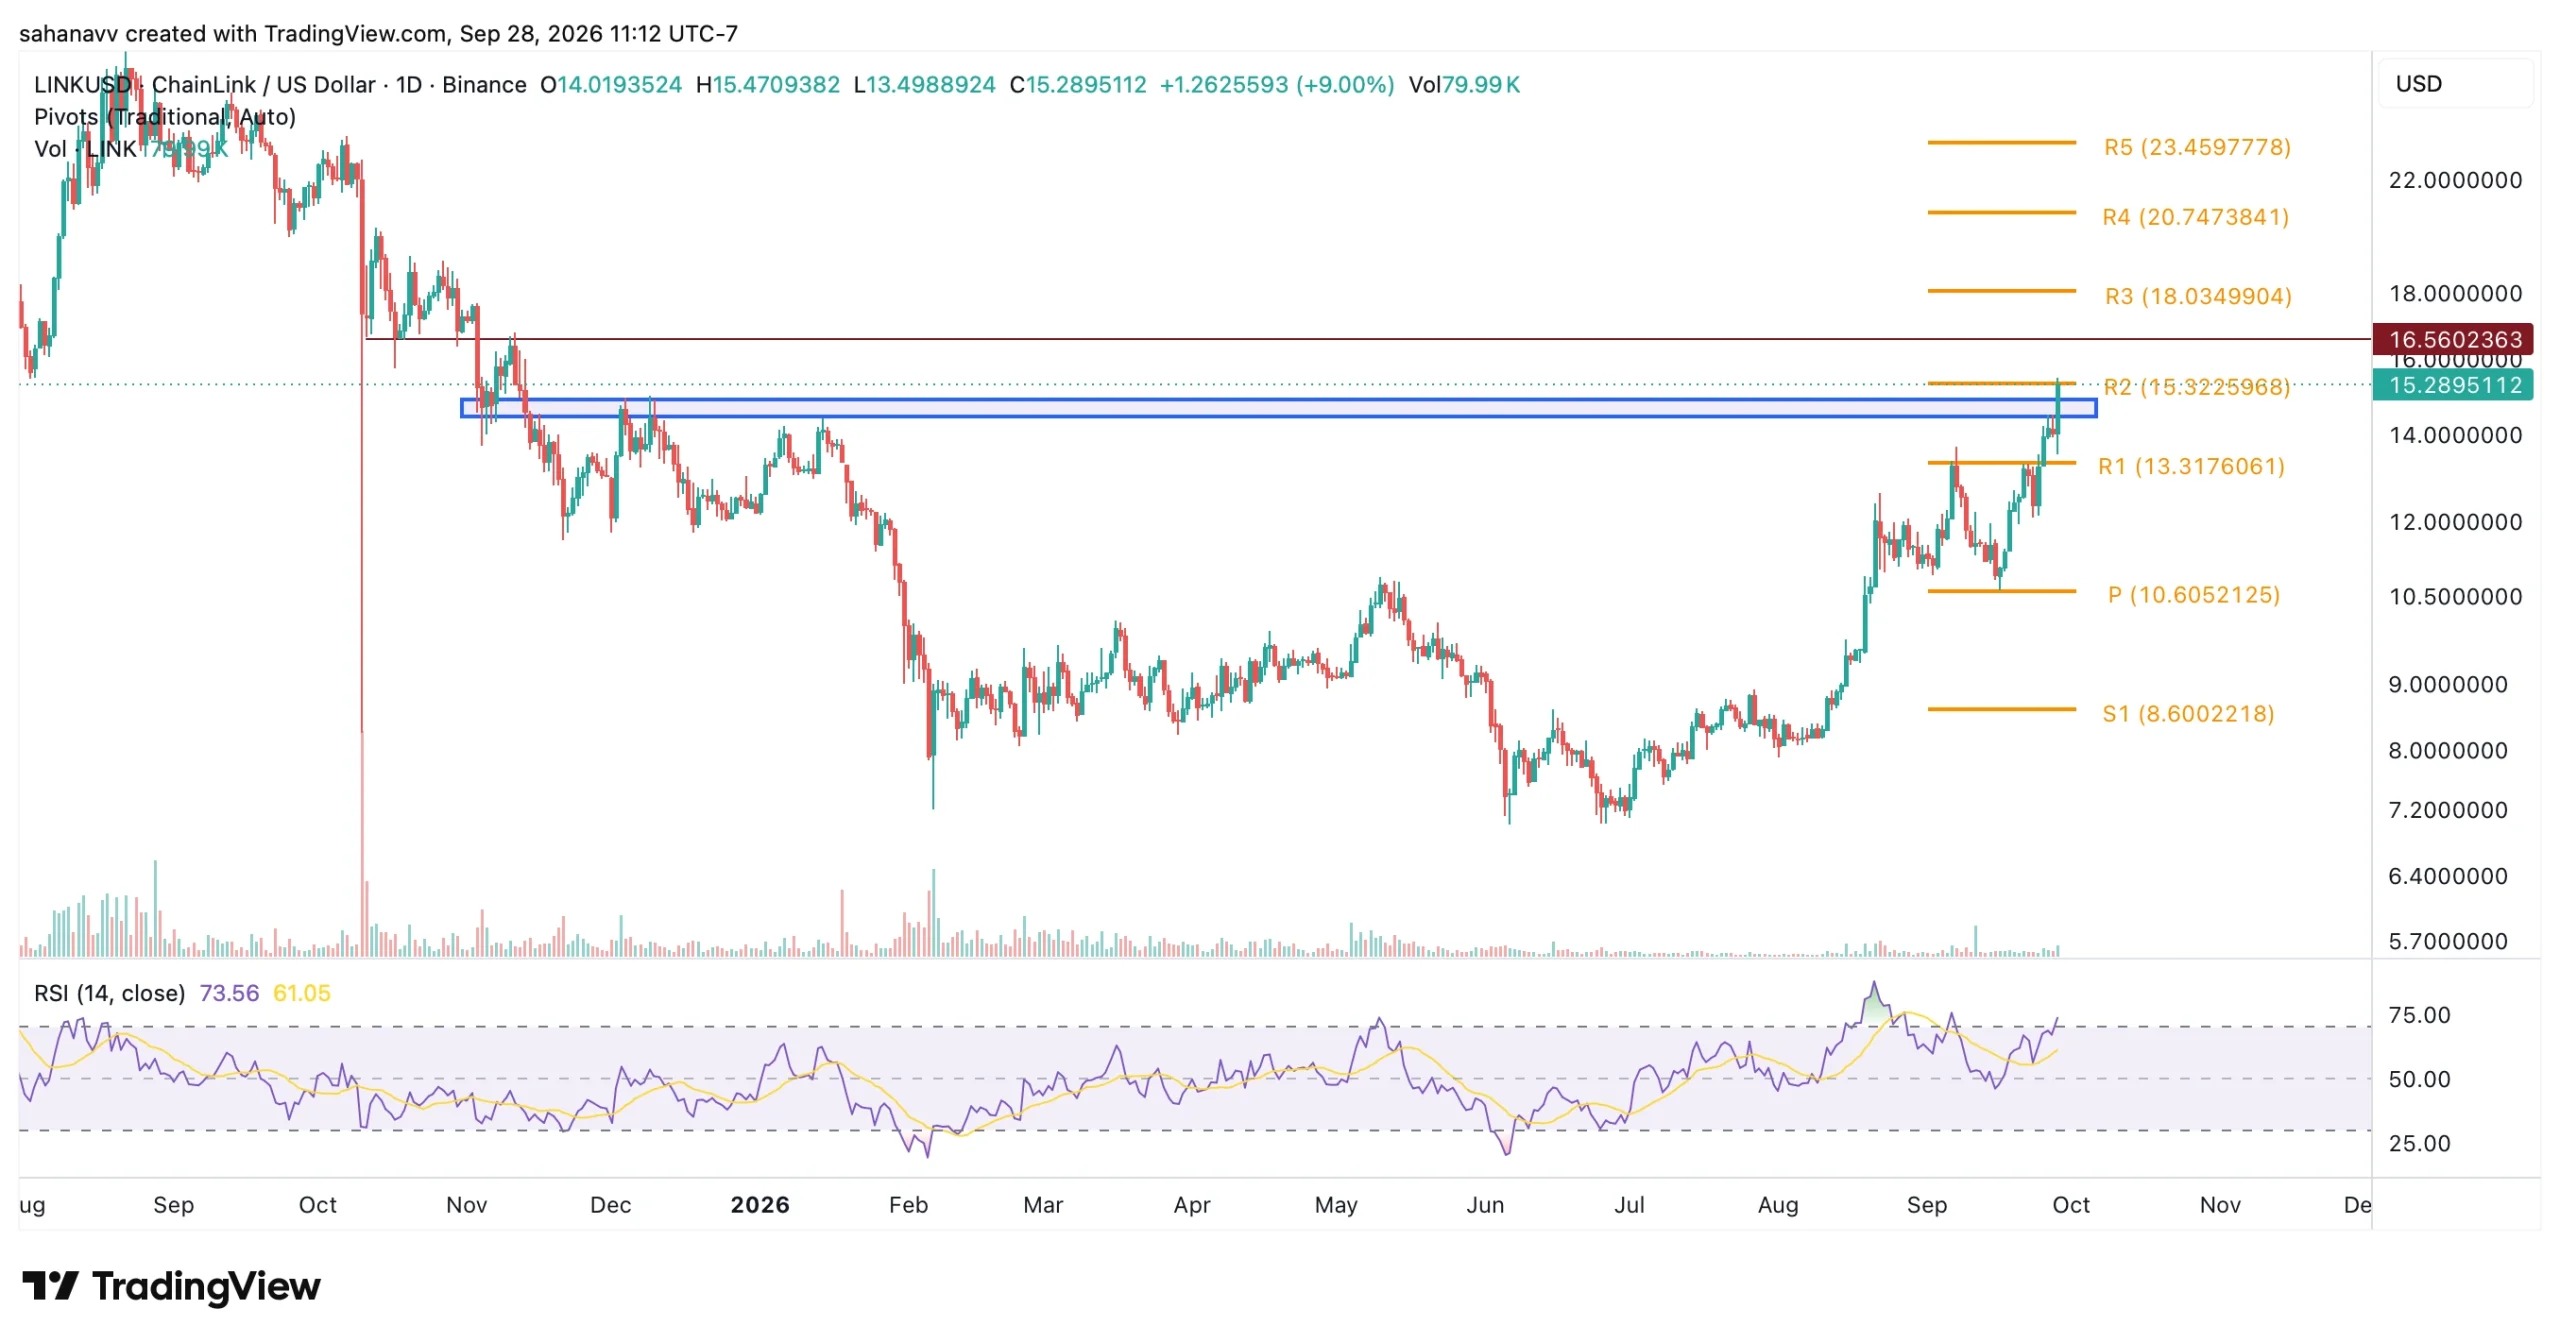
LINK has rebounded strongly from its June lows, but this round of gains is now approaching an important resistance area around $15.32. The daily chart shows that the trading price of LINK is close to $15.29, with the latest candlestick reaching $15.47 and pushing into the resistance zone that previously limited price increases. If the daily chart can close firmly above $15.32, it could open the way for the next resistance level at $16.56, followed by $18.03.
There is still an excess of momentum. The RSI indicator shows 73.56, indicating that the LINK area is in an overbought zone, which also suggests that buyers currently hold the upper hand. However, the relatively high RSI level means that if the bulls fail to establish support above $15.32, there may be a short-term profit-taking movement for the token. If the breakout is hindered, $13.32 will become the first key support level to watch; if there is further pullback, the $10.60 pivot point could come into focus.
Chainlink October Price Forecast: Can It Reach $20?
For October, the chart indicates a series of clear price levels rather than aggressive price forecasts: $15.32 is the first breakout trigger level, $16.56 is the next resistance level, and $18.03 is the next significant resistance level; if momentum continues to expand, higher price ranges could be seen between $20.75 and $23.46. To reach the $20 to $23 range, Chainlink ( LINK ), the price needs to maintain the current breakout structure and attract stronger participation; if that fails, the token could fall back near $13.32.