

This is the information you need to pay attention to before the market opens on September 30th.
The US Dollar Index ( DXY ) is rising, which is generally seen as bad news for Bitcoin ( BTC at $83,858.11) and other dollar-denominated assets such as gold. However, data indicates that this correlation is weaker than what this view suggests.
DXY tracks the performance of the US dollar relative to a basket of major currencies, including the euro and the Japanese yen. Since September 9th, the index has risen by about 2.6% and reached a two-month high of 101.69 on Tuesday.
The US dollar is the global reserve currency and is at the core of the global financial and debt system. When the US dollar strengthens, borrowers with US dollar-denominated debt face higher repayment costs and tend to reduce their exposure to risky assets. Conversely, a weakening US dollar has the opposite effect.
Therefore, in theory, a stronger dollar should suppress Bitcoin. In fact, since September 21st, Bitcoin's upward trend has stalled, with its price falling from near $87,500 to the range of $83,000 to $84,000. A stronger dollar may be limiting its upside potential, but so far, the damage caused is not significant.
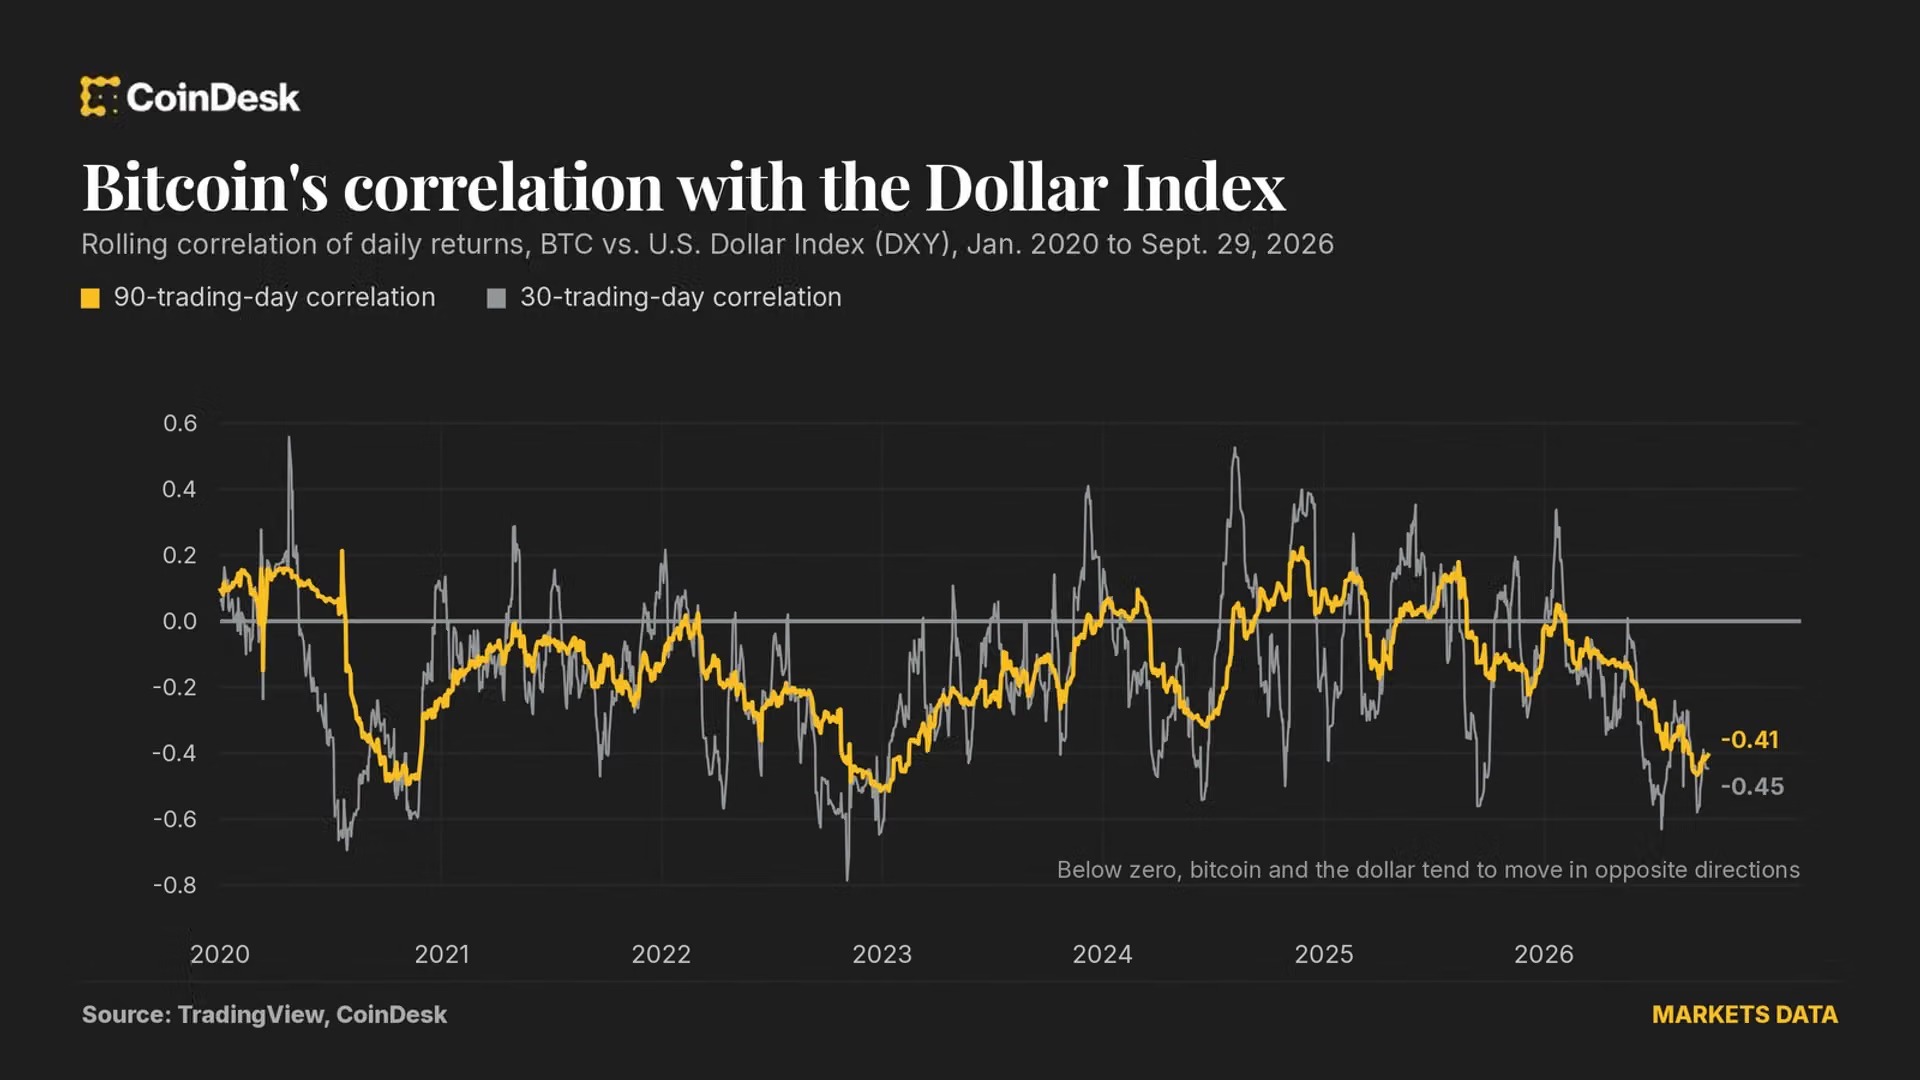
In addition, relevant data also supports this resilience. CoinDesk analysis of TradingView data shows that over the past 90 trading days, the daily correlation coefficient between Bitcoin and DXY has been -0.41. A negative value indicates that the two tend to move in opposite directions. This is the most negative reading since February 2023.
However, despite the existence of this correlation, as illustrated in the accompanying image, it is also quite limited. The R-squared value corresponding to this correlation is 0.17, which means that DXY can only explain about 17% of the fluctuations in Bitcoin's daily returns.
The shorter-term readings are even more noisy. The correlation coefficient for 30 days is -0.45, but this mainly depends on two days: August 19th and September 3rd, when DXY fell while Bitcoin surged by more than 5% each time. If these two days are excluded, the correlation coefficient drops to -0.19.
If we extend the time range even further, this correlation seems to become even weaker. Since January 2020, the average 90-day correlation coefficient has been -0.14, and it sometimes turns positive; in November 2024, it even rose to +0.22.
CoinDesk also recently discussed that there is almost no obvious correlation between Bitcoin and the yield of U.S. Treasury bonds.
Together with its loose association with the US dollar, this supports the argument that Bitcoin can serve as a diversification tool for investment portfolios, meaning it is an asset that is primarily influenced by its own underlying factors. Whether this independence will continue is worth watching. Stay vigilant!
For more analysis on today's trends in altcoins and derivatives, please refer to "Crypto Markets Today". For a complete list of events this week, please see "Crypto Week Ahead" in CoinDesk.
OpenAI, Google, and Meta have committed to undergoing external AI audits under a voluntary White House agreement ( CoinDesk ): OpenAI, Google, Meta, and three other technology companies agreed on Tuesday to bring in external auditors to review their AI security controls and signed a voluntary White House agreement; if they fail to meet the standards, they will not face any penalties.
There is a price level that Bitcoin bulls must hold onto ( CoinDesk ): The world's largest cryptocurrency once rose above $87,400 on September 21. Since then, the price has fallen back, testing the $82,000 to $83,000 range. This area is very important because Bitcoin peaked here in May and then dropped to around $57,000 in June.
After the 30-year yield rose to its highest level since 2002, the pressure on U.S. Treasury bonds eased ( CNBC ): Due to investors' concerns about inflation, government debt, and the potential for further tightening of monetary policy, U.S. Treasury bond yields fell on Wednesday, regaining some of the ground lost after heavy selling on the previous trading day.
Wall Street's hopes for a strong IPO quarter are fading ( WSJ ): Market volatility and concerns about artificial intelligence security are scaring off investors, disrupting what was expected to be a series of strong IPO events this fall.
Today's Signal
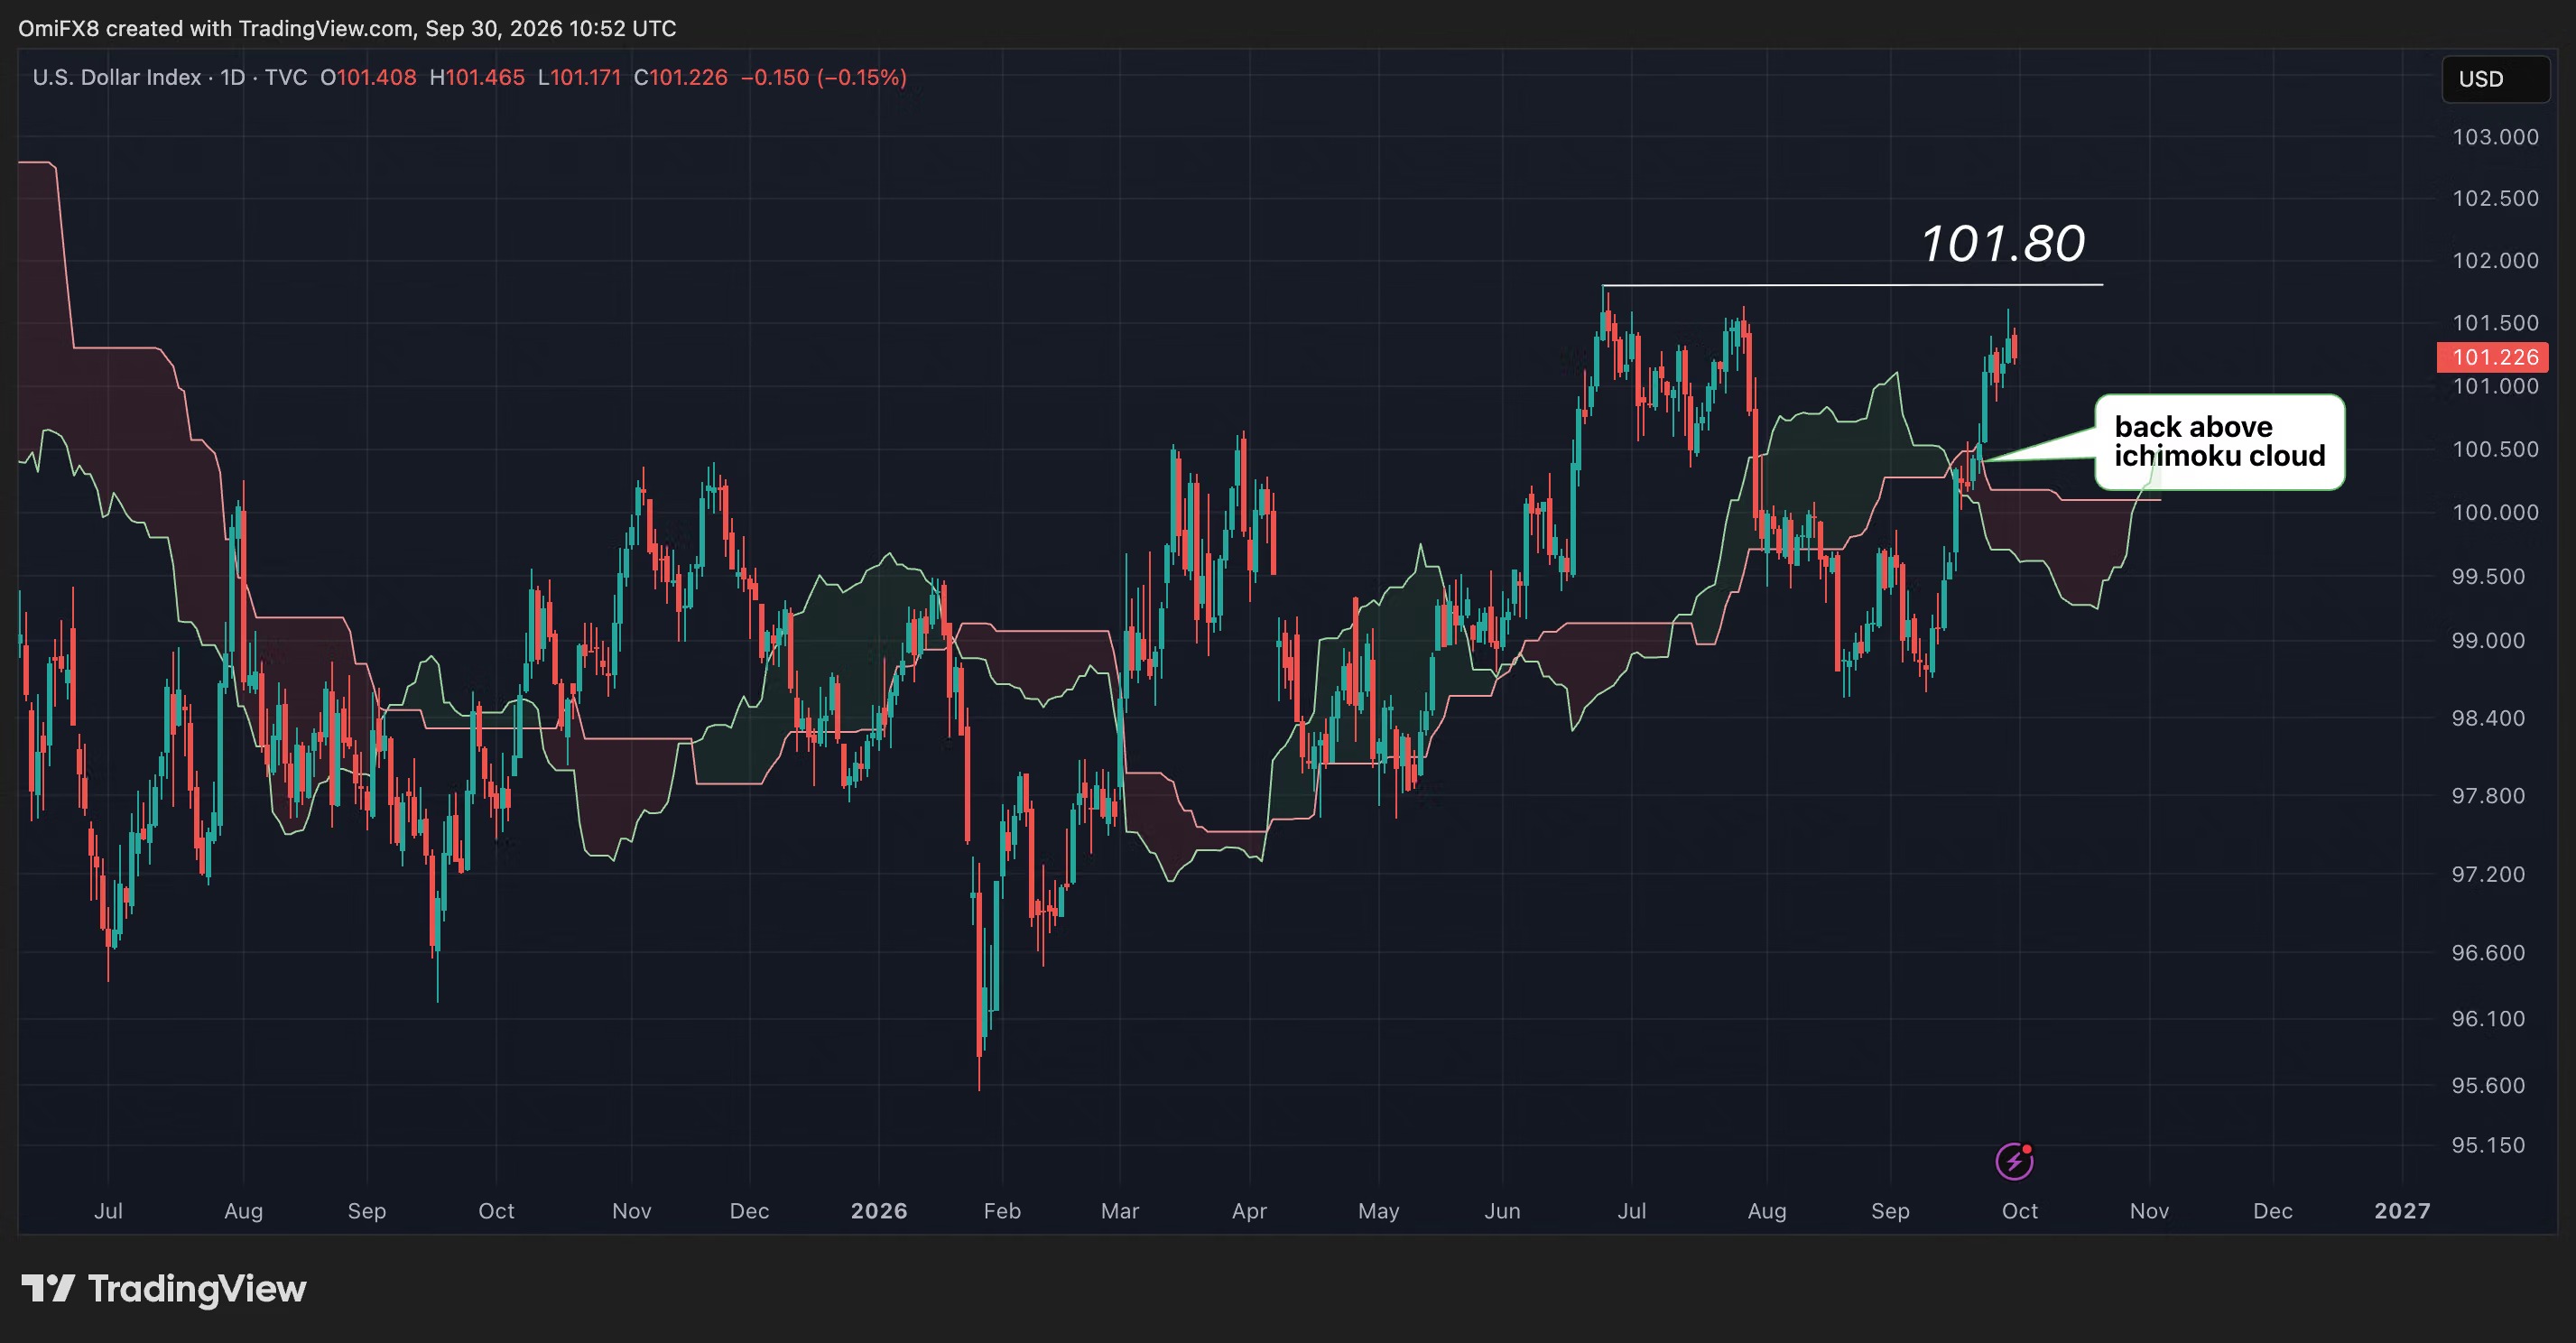
The chart displays the intraday price fluctuations of the US Dollar Index in the form of a candlestick chart.
DXY has traded above the Yimu Balance Cloud again, which is a momentum indicator suggesting that bullish momentum is strengthening. However, it has not yet broken through the immediate resistance level of 101.80, which is a high point set on June 24th.
If a breakthrough can be achieved at this position, it would indicate that the continuous sideways trading range since May 2025 has resulted in a bullish trend, and there could be an acceleration in the increase.