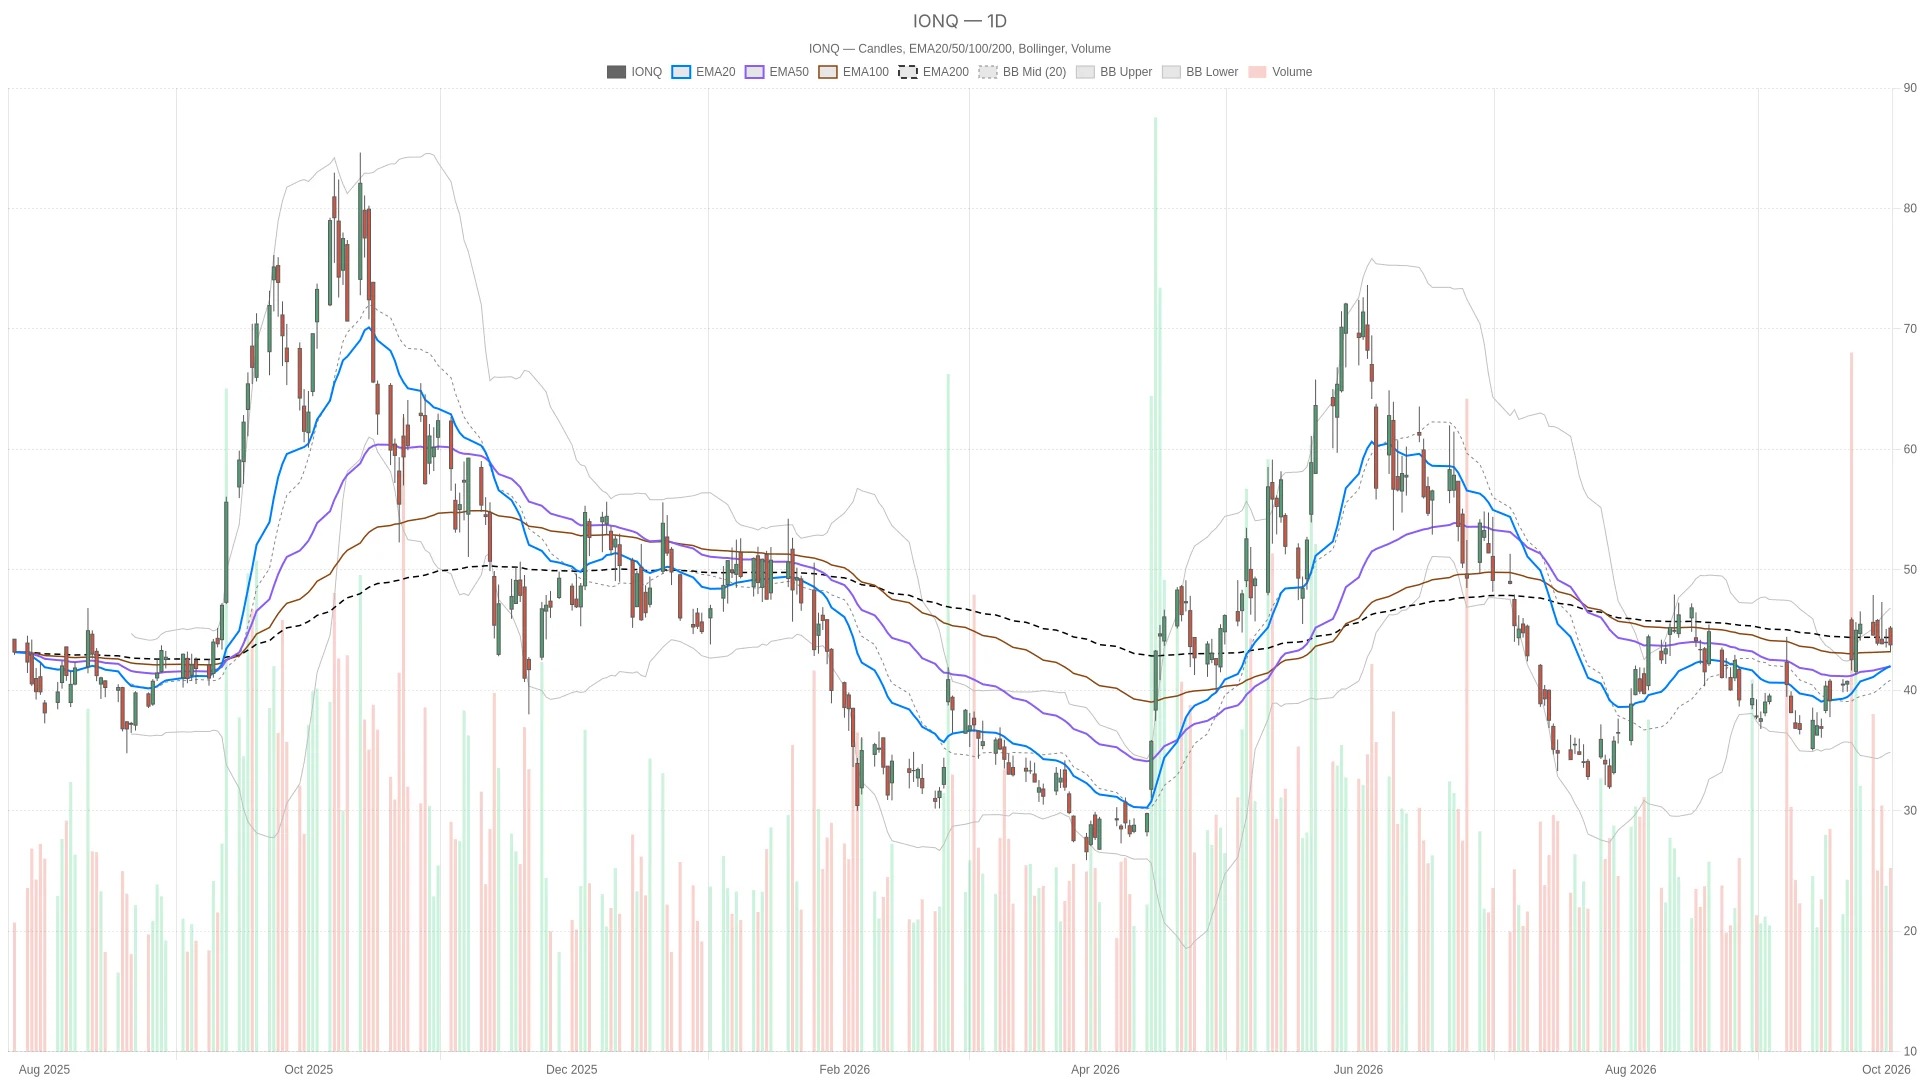
On Friday, October 2, 2026, the stock price of IonQ closed at $43.77, down 0.5% from the previous trading day's close. The stock opened at $45.16, with a low of $43.15 and a high of $45.34 during the session, and the previous closing price was $43.99. Over 200 trading days, EMA has been at $43.78.
Key Points
- IonQ shares closed at $43.77 on Friday, down 0.5%, slightly below the $43.78 level over the past 200 trading days EMA.
- The daily line RSI14 is at 57.38, which is higher than the neutral level of 50; the daily line MACD bar chart still shows a positive value of 0.5.
- The price is still higher than $42.01 over 20 trading days EMA and $41.97 over 50 trading days EMA.
- The hourly line RSI14 is at 45.67, which is below the neutral level of 50; the hourly line MACD in the bar chart is at -0.07.
- The daily pivot point for the next trading day is at $44.09, with the first resistance level at $45.02 and the first support level at $42.84.
Daily line structure: IonQ The stock price is exactly near the 200-day moving average.
IonQ The stock price closed at $43.77 on Friday, slightly lower than the $43.78 over 200 trading days EMA, but still higher than the levels over 20 and 50 trading days EMA.
The price remains above $42.01, which is the level for 20 trading days EMA, and $41.97, which is the level for 50 trading days EMA, allowing the short-term moving averages to be in a favorable arrangement. However, the closing price of $43.77 is slightly below $43.78, which is the level for 200 trading days EMA. This indicates that the stock price of IonQ is at the threshold of transitioning to a longer-term structure.
Meanwhile, on the daily chart, RSI14 has dropped from 58.24 to 57.38, which is still significantly higher than the neutral level of 50. The daily chart for MACD shows a value of 1.07, while the signal line is at 0.57, and the bar chart maintains a positive value of 0.5. The narrowing of the bar chart from 0.61 indicates that the gap between MACD and the signal line has slightly decreased.
The price is between the 20-day moving average midband of $40.85 and the upper band of $46.84, closer to the midband than the upper band. The daily ATR14 indicator is at 2.7. The closing price on Friday was below the pivot point, which makes it the first resistance level for any attempt at a rebound.
Hourly chart momentum turns in the opposite direction.
The hourly chart shows that the stock price of IonQ is below the 20-hour and 50-hour EMA levels, with the MACD bar chart indicating -0.07. This contradicts the still relatively positive daily chart.
On the one-hour chart, the 20-day EMA is at $44.23, which is higher than the 50-day EMA at $43.88; the 50-day EMA in turn is higher than the 200-day EMA at $42.26. However, the price is lower than both the 20-day and 50-day EMA, but still higher than the 200-day EMA.
The hourly chart RSI14 rose from 44.07 to 45.67, still below the neutral level of 50. The hourly chart MACD shows a value of -0.12, the signal line at -0.05, and the bar chart at -0.07. This negative value on the bar chart represents the main point of divergence between this time frame and the daily time frame.
The price is between the lower band of $43.50 and the middle band of $44.24 on the hourly chart, closer to the lower band. The ATR14 indicator on the hourly chart has dropped from 0.87 to 0.85. The pivot point for the next trading day's hourly chart is at $43.57, with the first resistance level at $44.00 and the first support level at $43.35.
15-minute chart: Observations at the execution level
On the 15-minute chart, the 50-period EMA is at $44.31, which is higher than the 20-period EMA at $44.13; the 20-period EMA in turn is higher than the 200-period EMA at $43.65. The price closed below both the 20-period and 50-period moving averages, but it is still above the 200-period moving average—this is consistent with the pattern on the hourly chart.
However, in the 15-minute time frame, the RSI14 indicator rose from 31.86 to 42.2. Although there was a rebound, it remained below the neutral level of 50. The 15-minute MACD line was at -0.22, the signal line was at -0.11, and the bar chart also showed -0.11, which represents an improvement from -0.13. Nevertheless, it remained negative and below the signal line, consistent with the negative hourly bar chart at the start of the next trading day.
The price is between the 15-minute lower band of $43.44 and the middle band of $44.28, closer to the lower band. The 15-minute ATR14 has risen from 0.37 to 0.38. For the next trading day, the 15-minute pivot point is at $43.60, with the first resistance level at $43.97 and the first support level at $43.41.
IonQ What news is there currently surrounding the stock price?
Before trading on Friday, there were a total of five news articles surrounding the stock price of IonQ, covering advancements in quantum computing and discussions on Wall Street valuations.
An article published by Motley Fool during the trading session on Friday stated that the stock price of IonQ rose by 11.6% in September. The article attributed part of this increase to the company's launch of a new quantum computing platform, while also pointing out that this platform was not the only factor contributing to the increased interest from investors.
In addition, a report with the identifier Yahoo Finance published before the market opened on Friday stated that IonQ has developed a real-time quantum error-correction decoder that can handle complex workloads without slowing down quantum computing. The report also mentioned that a new deployment of NVIDIA Accelerated Quantum Research Center will integrate IonQ hardware into NVIDIA's quantum research technology stack.
Another report with the identifier Yahoo Finance, also released before the opening on Friday, stated that the updated valuation framework pointed to a fair value of $66.63 for the stock, which is lower than the previous $68.41. The report indicated that this adjustment was in line with recent Wall Street research, which seeks a balance between long-term optimism about quantum computing and short-term risks.
Meanwhile, a comparative article published by Yahoo Finance on Thursday stated that IonQ exhibited triple-digit growth, but the rate of cash consumption was astonishing. The article compared it with SoundHound AI, which was smaller in scale but closer to profitability.
IonQ Bullish Scenario for Stock Prices
If the price closes back above $43.78 for 200 consecutive trading days EMA, and holds that level, the bullish outlook for the stock price IonQ will strengthen. This will transform that moving average from a resistance level to a support level. Subsequent tests above that level will be at the daily pivot point of $44.09, followed by the first daily resistance level of $45.02.
A faster confirmation cycle would also be helpful. The hourly chart RSI14 needs to return above 50 from the current 45.67, and the bar chart for the hourly chart MACD also needs to turn from -0.07 to a positive value.
Bearish scenario and its negative conditions for upward judgment
If the price fails to re-establish above the level of 200 trading days EMA, and instead falls back to around the first support level of 42.84 USD on the daily chart, then a bearish scenario will unfold. If the daily closing price breaks below 42.01 USD, which is the support level for 20 trading days EMA, and 41.97 USD, which is the support level for 50 trading days EMA, then there will be a more definitive breakdown in the short-term structure.
On the hourly chart, if it falls below the first support level of $43.35, it will further exacerbate the short-term weakness, and the current negative MACD bar chart already reflects this pressure. The hourly RSI14 level is currently at 45.67, which is still below 50.
Closing Conclusion
IonQ closed at $43.77 on Friday, with the daily chart still above the shorter-term moving average, while the MACD bar chart on the hourly scale still showing negative values. The level of $43.78 from 200 trading days EMA is the first level that needs attention. The daily pivot point of $44.09 and the first support level of $42.84 form the range framework for the next trading day.
The daily line ATR14 is at 2.7, reflecting the recent range of fluctuations for this stock. Overall, the signals on the daily and hourly lines are not consistent. Before the turning points indicated by the hourly line RSI14 and MACD (in bar charts) were favorable for this stock, the short-term direction remains uncertain.
Frequently Asked Questions
What are the key levels of stock price that need attention for IonQ?
On 200 trading days, $43.78 EMA is the level that requires immediate attention. If the daily close remains above this level, it will maintain a broader structural integrity; if it falls below, then sellers will gain more control.Why do there be discrepancies between daily and hourly line charts?
The daily chart shows that the stock price of IonQ is above the shorter-term moving average, which is 57.38 for RSI14. The bar chart for MACD indicates a value of 0.5. However, the hourly chart shows that the price is below the 20-hour and 50-hour EMA averages, with a value of 45.67 for RSI14 and a bar chart value of -0.07 for MACD. This divergence suggests that the daily structure is still intact, but short-term selling pressure makes any immediate rebound more complicated.What is the pivot point for the next trading day?
The daily pivot point is at $44.09, with the first resistance level at $45.02 and the first support level at $42.84. On Friday, the price closed at $43.77, which is below the daily pivot point, making it the first obstacle to any rebound attempts.What news is there about the stock price of IonQ on Friday?
Motley Fool reported during the trading session on Friday that IonQ rose by 11.6% in September. Yahoo Finance reported on a new quantum error-correction decoder, made a valuation adjustment to $66.63, and mentioned that two Wall Street institutions believe the stock has the potential to more than double in value.Cryptonomist and the author do not hold any positions in the financial instruments mentioned in this text, nor have they received any compensation from the companies reported.
This article was generated with the assistance of artificial intelligence and has been reviewed by an editorial team.