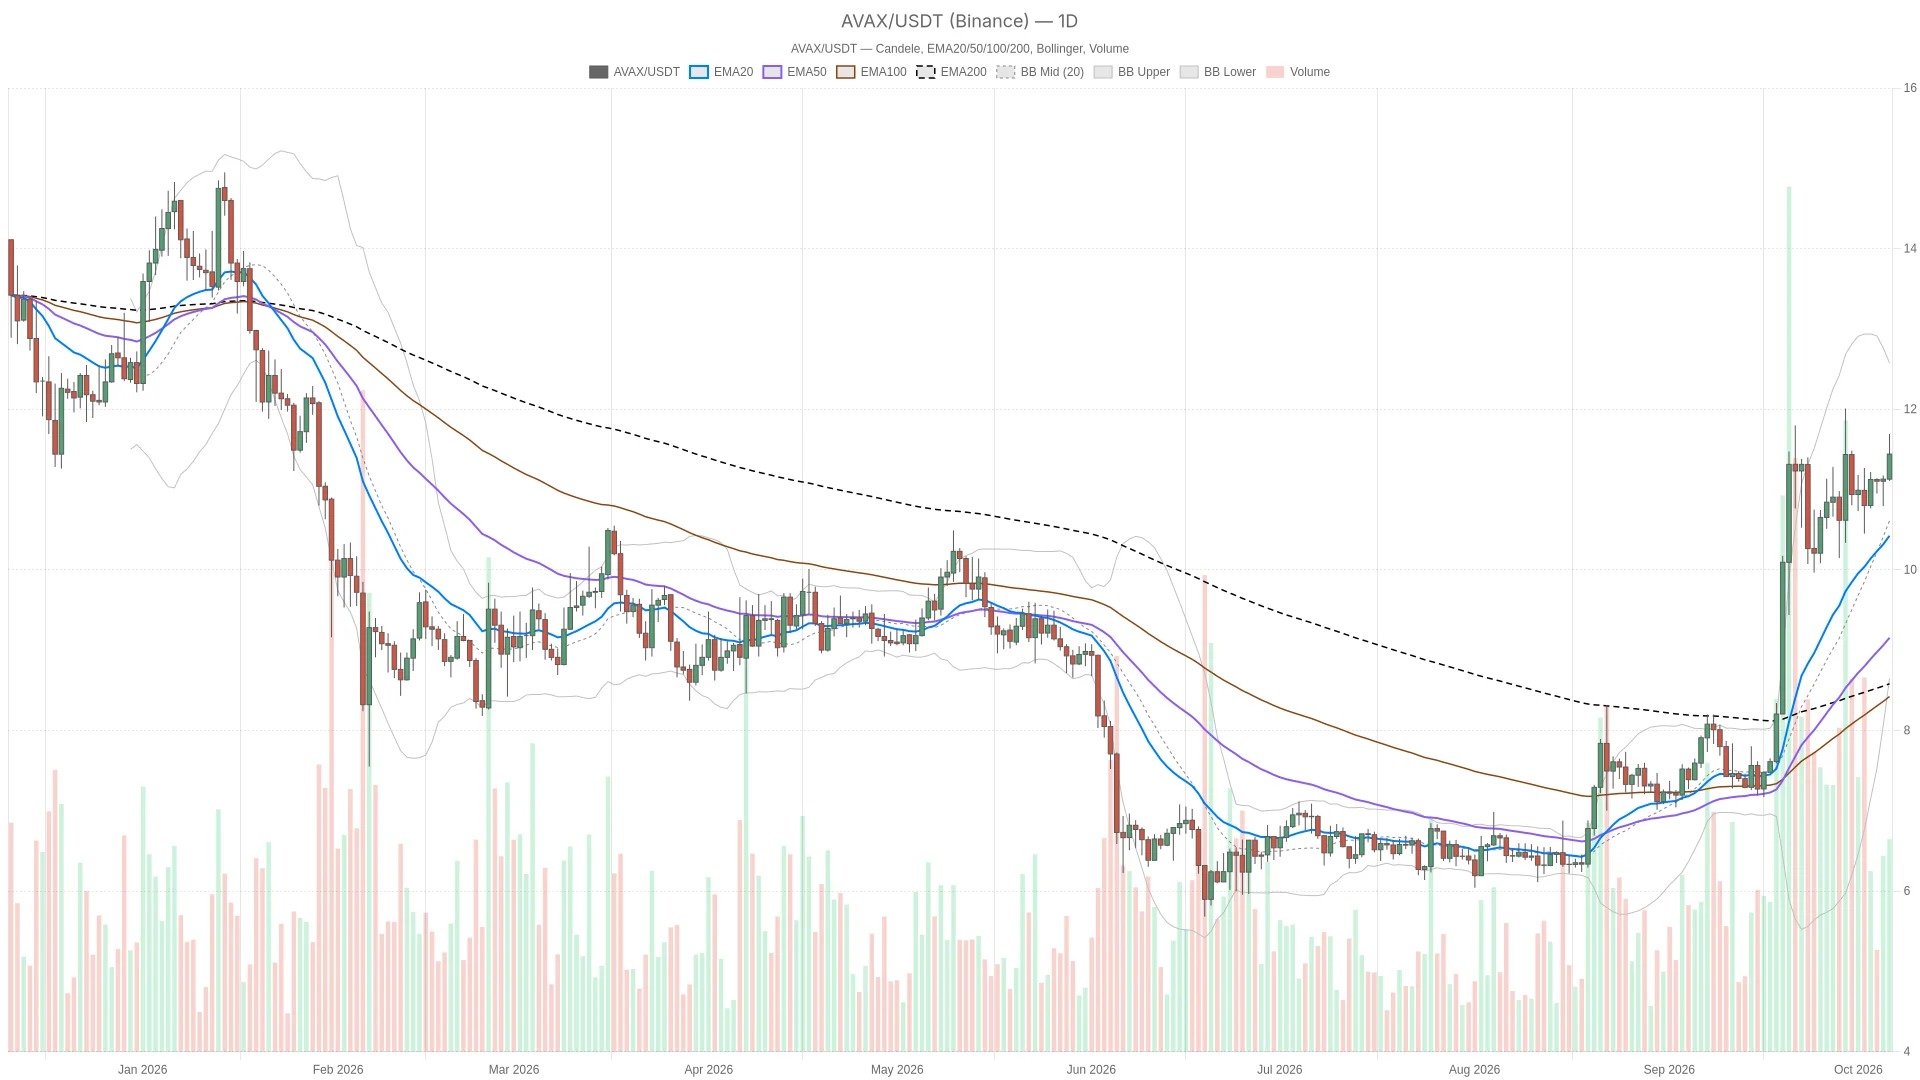
As of October 6, 2026, the price of Avalanche was reported at $11.44 near Binance, above all major daily moving averages; meanwhile, the broader crypto market has fallen by 2.54% in the past 24 hours, according to CoinGecko data. AVAX is making an attempt to break through resistance levels, while the overall market is pulling back – such a divergence usually resolves quickly.
Key Points
- The trading price is close to $11.44, and on the daily, hourly, and 15-minute charts, it is above EMA20, EMA50, and EMA200. Additionally, the moving averages are arranged in a bullish pattern.
- On the daily chart, the MACD bar chart shows a value of -0.0494, and this trend continues to widen, indicating that although the price is still close to its high level, the momentum is weakening.
- The total market value of the broader crypto market fell by 2.54%, to 2.94 trillion US dollars; Fear & Greed Index is 73 (greed), with Bitcoin accounting for 58.79%.
- The trading volume of DEX on Avalanche totaled 130.25 million US dollars in 24 hours, however, the 7-day trends on various platforms vary.
The dominant force remains the structurally intact daily upward trend. The price is above EMA20, EMA50, and EMA200, and these three levels are arranged in a bullish pattern. However, the underlying momentum is gradually weakening. On the hourly chart, RSI is already in a deeply overbought area and is still moving upwards. This situation will either continue to break through resistance with new buying pressure or fall back after the short-term buying power is exhausted. The tension between the strong daily trend and the overheated hourly readings is the core of this report.
The overall market has cooled down, while the activities on the Avalanche chain have increased.

The overall crypto market is cooling down. CoinGecko data shows that the total market value has fallen by 2.54% in the past 24 hours, to 2.94 trillion US dollars. Bitcoin accounts for 58.79%. The Fear & Greed Index indicators read 73, which is within the “greedy” range. Despite the contraction in total market value, risk appetite remains on the positive side – this is a slight inconsistency.
On the Avalanche chain, the trading volume on the DEX platform over the past 24 hours totaled approximately 130.25 million US dollars. This refers to the overall trading volume on the chain, not the transaction fees, nor is it exclusive data of AVAX. The daily performance seems generally strong: Uniswap V3 rose by 163.73%, Blackhole CLMM by 152.27%, Joe V2 by 118.06%, Pharaoh DLMM by 116.56%, and Pharaoh V3 by 97.12%. However, the 7-day trend is more mixed: Joe V2 fell by 61.17%, Blackhole CLMM by 41.14%, while Pharaoh DLMM rose by 147.08% and Uniswap V3 by 17.75%. A strong day alone cannot erase the differentiation in weekly performance.
Avalanche The price has stabilized above all EMA on all three time frames.
AVAX is located above EMA20, EMA50, and EMA200 on all major time frames, with the moving averages arranged in a bullish order. On the daily chart, the price of $11.44 is higher than $10.32 for EMA20, $9.06 for EMA50, and $8.55 for EMA200. The system marks the daily trend as bullish. The hourly chart confirms this as well: the price of $11.43 is higher than $11.23 for EMA20, $11.12 for EMA50, and $10.98 for EMA200. The 15-minute chart shows the same pattern—prices are above $11.41 for EMA20, $11.30 for EMA50, and $11.12 for EMA200, with the bullish arrangement remaining unchanged.
However, the real-time price of $11.43 on the hourly and 15-minute charts is slightly lower than the closing price of $11.52 of the previous completed candlestick. This is merely a short-term pullback within the candlestick and does not represent a reversal of the trend. The alignment of EMA across the three time frames has not changed. As long as all three time frames show the same bullish EMA pattern, even if the recent price movement has cooled down, the larger structure still appears intact.
On the daily chart MACD, the bar chart shows weakening trends, while on the hourly chart RSI, it is approaching overbought levels.
On the daily chart, RSI is at 65.24, which is strong, but there has been no further acceleration; the recent three closing prices were 65.3, 65.0, and 65.2, respectively, showing little change. On the hourly chart, RSI, however, is different—it is at 76.85, in an overbought area, and has been rising continuously in the last three readings (68.0, 73.5, 76.9). This trend requires new buying support; otherwise, it is likely to cool down. On the 15-minute chart, RSI is at 59.24, with a rather mixed direction (61.6, 58.1, 59.2), and there are almost no clear signals for direction.
MACD further adds to this sense of tension. On the daily chart, the bar chart shows a value of -0.0494, and this value has been continuously increasing in the recent three readings (-0.0159, -0.0338, -0.0494). This indicates that even though the price is still trading near high levels, the momentum is weakening, which is worth noting. On the hourly chart, however, the situation is the opposite: the value is 0.0304, and it has been continuously rising and expanding (0.0222, 0.0252, 0.0304). Short-term momentum is strengthening in the current direction. The 15-minute bar chart shows a positive value but a smaller figure of 0.0145, and it is declining and narrowing (0.0221, 0.0174, 0.0145), which is consistent with the aforementioned slight pullback.
Meanwhile, the daily Bollinger Bands have expanded from $8.06 to $12.76, with the middle band at $10.41. The price is firmly in the upper half of the range, and there is still room above it. The hourly Bollinger Bands are narrower, ranging from $10.82 to $11.54, with the middle band at $11.18. The current real-time price of $11.43 is close to the upper band, which is considered a somewhat stretched reading on a smaller time frame. The daily ATR is at $0.67, the hourly ATR is at $0.13, and the 15-minute ATR is at $0.088. The lower you look on the time frame, the more stable the volatility becomes.
Key price levels, and what will confirm or undermine a trend
AVAX is currently trading at $11.44, which is already above the daily high of $11.27 for R1. Therefore, the next resistance level is the upper band of the daily Bollinger Bands at $12.76. The support levels below are sequentially at the daily R1 ($11.27), the daily pivot point ($11.03), the daily S1 ($10.89), the middle band of the Bollinger Bands ($10.41), and the daily EMA20 ($10.32).
On the hourly chart, the resistance levels are sequentially the upper Bollinger Band (11.54 USD), the hourly pivot point (11.55 USD), and the hourly R1 (11.66 USD). The support levels are at the hourly S1 (11.41 USD), the hourly EMA20 (11.23 USD), the middle Bollinger Band (11.18 USD), and the hourly EMA50 (11.12 USD).
The bullish scenario depends on the hourly close exceeding $11.66. If this occurs, it will create room to move towards the upper band of the daily Bollinger Bands at $12.76. If the daily close falls back below the daily support level of $11.27, then this scenario will not hold true.
On the contrary, a bearish scenario depends on the hourly close falling below $11.41. If this occurs, it will expose the hourly pivot point of $11.12 and bring the daily pivot point of $11.03 back into focus. If the hourly close returns above the hourly pivot point of $11.55, then this scenario will not hold true.
The hour RSI is in an overbought state at 76.85, which increases the likelihood of a short, rapid pullback while the overall upward trend remains intact. The most likely misjudgment would be to consider the hour EMA20 when the price falls back to 11.23 dollars as a reversal of the trend. Taken alone, this would not undermine the daily chart structure, which still has the price above all three daily lines EMA. However, if such pullbacks are accompanied by a daily close below the daily line R1, then the broader bullish outlook would need to be re-evaluated.
Frequently Asked Questions
What is the current price of AVAX?
As of October 6, 2026, AVAX was trading at $11.44 near Binance. The previous completed daily candle closed at $11.13.
Avalanche Is it bullish or bearish on the daily chart?
The daily chart shows a bullish trend: the price is above EMA20, EMA50, and EMA200, and the moving averages are arranged in a bullish pattern, with RSI at 65.24. However, the bar chart for the daily MACD is negative and continues to widen, indicating that even though the price remains near its high level, the momentum is weakening.
AVAX Is it overbought now?
The hourly line RSI is at 76.85, which is in the overbought range, and it has been rising in the last three readings. The daily line RSI and the 15-minute line RSI are both not in the overbought range, at 65.24 and 59.24 respectively.
Where is the key resistance level for Avalanche?
On the hourly chart, the resistance levels are at the upper Bollinger Band (11.54 USD), the hourly pivot point (11.55 USD), and the hourly R1 (11.66 USD). On the daily chart, since the price is already above the daily R1 (11.27 USD), the next resistance level is the upper Bollinger Band of 12.76 USD.
This article was generated with the assistance of artificial intelligence and has been reviewed by an editorial team.