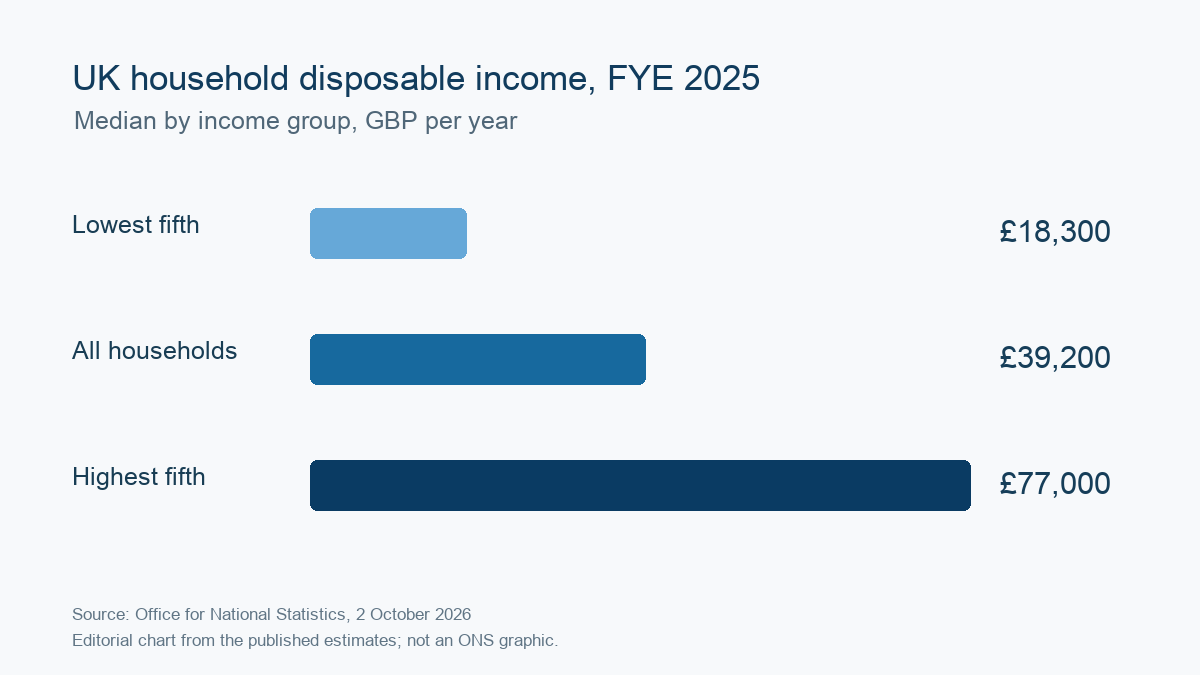
On October 2, the Office for National Statistics (ONS) in the UK released data on household incomes for the fiscal year ending March 2025. After adjusting for inflation and household size, the median disposable income for British households was £39,200, representing a 3.5% increase from the previous fiscal year. The median income for the poorest fifth of households rose by 5.6% to £18,300, while that for the richest fifth increased by 5.0% to £77,000. These figures present a positive picture of income growth, but they refer to the fiscal year from April 2024 to March 2025, not the current wage situation as of October 2026. Moreover, we must not overlook the ONS' warnings regarding the quality of the sample data.
The reason why household income is more in line with the perception of living standards than the average wage is that it takes into account employment income, pension, investment income, and cash benefits, and then deducts direct taxes such as income tax, national insurance, and local taxes. The statistical bureau also uses an equalization method to account for differences in the number of people in each household. A two-person household needs more money than a single person, but it's not necessary to simply double that amount. When reading this report, it's best to first clarify the three concepts of “household,” “disposable income,” and “median” before discussing who truly benefits from it.
What does a 3.5% rebound mean?
The median sorts households by income and takes the middle position, which is less affected by a small number of high-income households compared to the simple average. The 3.5% growth reported by the statistical bureau represents a substantial change, meaning that after considering inflation, one should no longer simply subtract the nominal salary increase from the inflation rate to represent the official figures. This indicates that as of March 2025, the income distribution center for the majority of households has improved, but it does not mean that every household has seen a 3.5% increase, nor does it imply that the perceived pressure of housing, energy, and service consumption has disappeared.
Grouped numbers also need to be read carefully. The median disposable income of the poorest fifth of households is 18,300 pounds sterling, which the Office for National Statistics says has returned to the level before the pandemic, as of the 2020 fiscal year; for the richest fifth, it is 77,000 pounds sterling, returning to the level of the 2021 fiscal year. An increase at both ends does not mean that the wealth gap has automatically disappeared. The Gini coefficient in the report decreased slightly by 0.2 percentage points from the previous fiscal year to 32.7%, remaining relatively stable overall; the ratio of the average disposable income of the highest to the lowest fifth of households is still about 5.6 times. It is possible for there to be an improvement in absolute income levels while the structural gap continues to exist.
Why use a fifth as the grouping unit instead of a more detailed tenth? Because the more the sample is divided into smaller segments, the more likely changes in the composition of the minority of surveyed households will influence the results. Household financial surveys do not involve registering every household in the UK individually; instead, the overall population is estimated based on a sample. The Office for National Statistics specifically noted that the fiscal year 2025 was a transitional year for the change in survey sources, with the sample size decreasing by about 29%. During this period, the proportion of data related to living costs and food surveys in the underlying data increased from 38% in the previous year to 63%. This introduces additional uncertainty for more specialized subgroups.
Changes in retired families require even more caution. According to the Bureau of Statistics, the income of some retired families does not seem to correspond consistently with other official statistics. The proportion of relatively affluent retired families owning their own homes has increased in the sample, and the existing weighting may not fully eliminate this change in composition. Therefore, it is not appropriate to take the fluctuations of a single decile or a certain type of retired family over a year and directly attribute them to national policy effects. A more cautious judgment would be that the overall trend and the trends at the one-fifth level are generally consistent with other official statistics, but the detailed results need to be considered in conjunction with errors and sample explanations.
After income improves, consumption and savings still depend on the current situation.
This data was released in October 2026, but it looks back at the fiscal year ending March 2025. The time difference means it is suitable for answering questions about how household income distribution in the UK changed over that year, but not suitable for independently determining whether British consumers are more willing to spend money this month. To assess current purchasing power, it is also necessary to consider subsequent data on wages, employment, inflation, mortgage rates, and retail sales. Treating lagging household surveys as a real-time economic thermometer can lead to investment and business decisions that are out of sync with current trends.
Disposable household income is not equivalent to the amount of cash on hand. Repayment of mortgage principal, credit debts, tuition fees, and housing rent can significantly reduce the amount of money that is freely available for spending, while the official definition of disposable income mainly refers to the income after deducting direct taxes. Differences in housing costs across regions also affect the standard of living that can be achieved with the same income. Therefore, a median income of £39,200 does not mean that families in all regions have the same discretionary spending power.
For macro observers, what is most useful about this release is not just the single growth rate, but rather the combination of three factors: overall purchasing power has rebounded compared to last year, there has been improvement at both ends of the distribution, and the detailed data has become more volatile due to changes in the survey methodology. The first two points prevent excessive pessimism, while the third point helps to avoid overinterpreting the numbers. Only if samples in subsequent years become more stable and we can observe continuous changes among the same group of households and income strata, can we more confidently distinguish between temporary rebounds and long-term improvements.
The more detailed the data, the more explanatory it appears, and the more necessary it is to inquire about the source of the samples. While announcing an increase in income, the UK Office for National Statistics proactively disclosed its limitations, which actually provided the correct perspective for reporting: it can be said that the median household income as of March 2025 has increased substantially; however, it cannot be claimed that everyone's income has increased by 3.5%, nor can changes in subgroups with significant sampling uncertainties be described as definite trends. The value of this report lies in the fact that good news and reservations must be read together.
Source: Office for National Statistics, UK, " Average household income , UK : financial year ending 2025", October 2, 2026, https :// www.ons.gov.uk / peoplepopulationandcommunity / personalandhouseholdfinances / incomeandwealth / bulletins / householddisposableincomeandinequality / financialyearending2025