SoundHound AI shares closed near $4.99 on Monday, down 7.51%. The stock price fell below three daily moving averages and was also below the lower band of the daily Bollinger Bands. The hourly chart confirmed a bearish trend, and the oversold reading for RSI made the outlook more complex, but it was not enough to offset the negative signals for MACD.
Key Points
- SoundHound AI shares closed at around $4.99 on Monday, a decrease of 7.51% from the previous closing price of $5.39.
- The daily line RSI14 is at 24.13, while the daily line MACD has a value of -0.06; the stock price is below the lower band of the daily Bollinger Bands at 5.29 USD.
- The stock price is below the 20-day EMA of $5.86, the 50-day EMA of $6.28, and the 200-day EMA of $7.82.
- The 15-minute MACD column value is 0.01, which is a positive value; whereas the daily MACD column value is -0.06, which remains negative.
On Monday, October 12, 2026, SOUN opened at $5.33, hit a low of $4.96 during the session, and closed near $4.99. The latest price at 16:29 Eastern Time was $4.985, representing a decrease of 7.51% from the previous closing price of $5.39 on October 9, 2026.
The SoundHound AI daily chart shows a bearish structure.
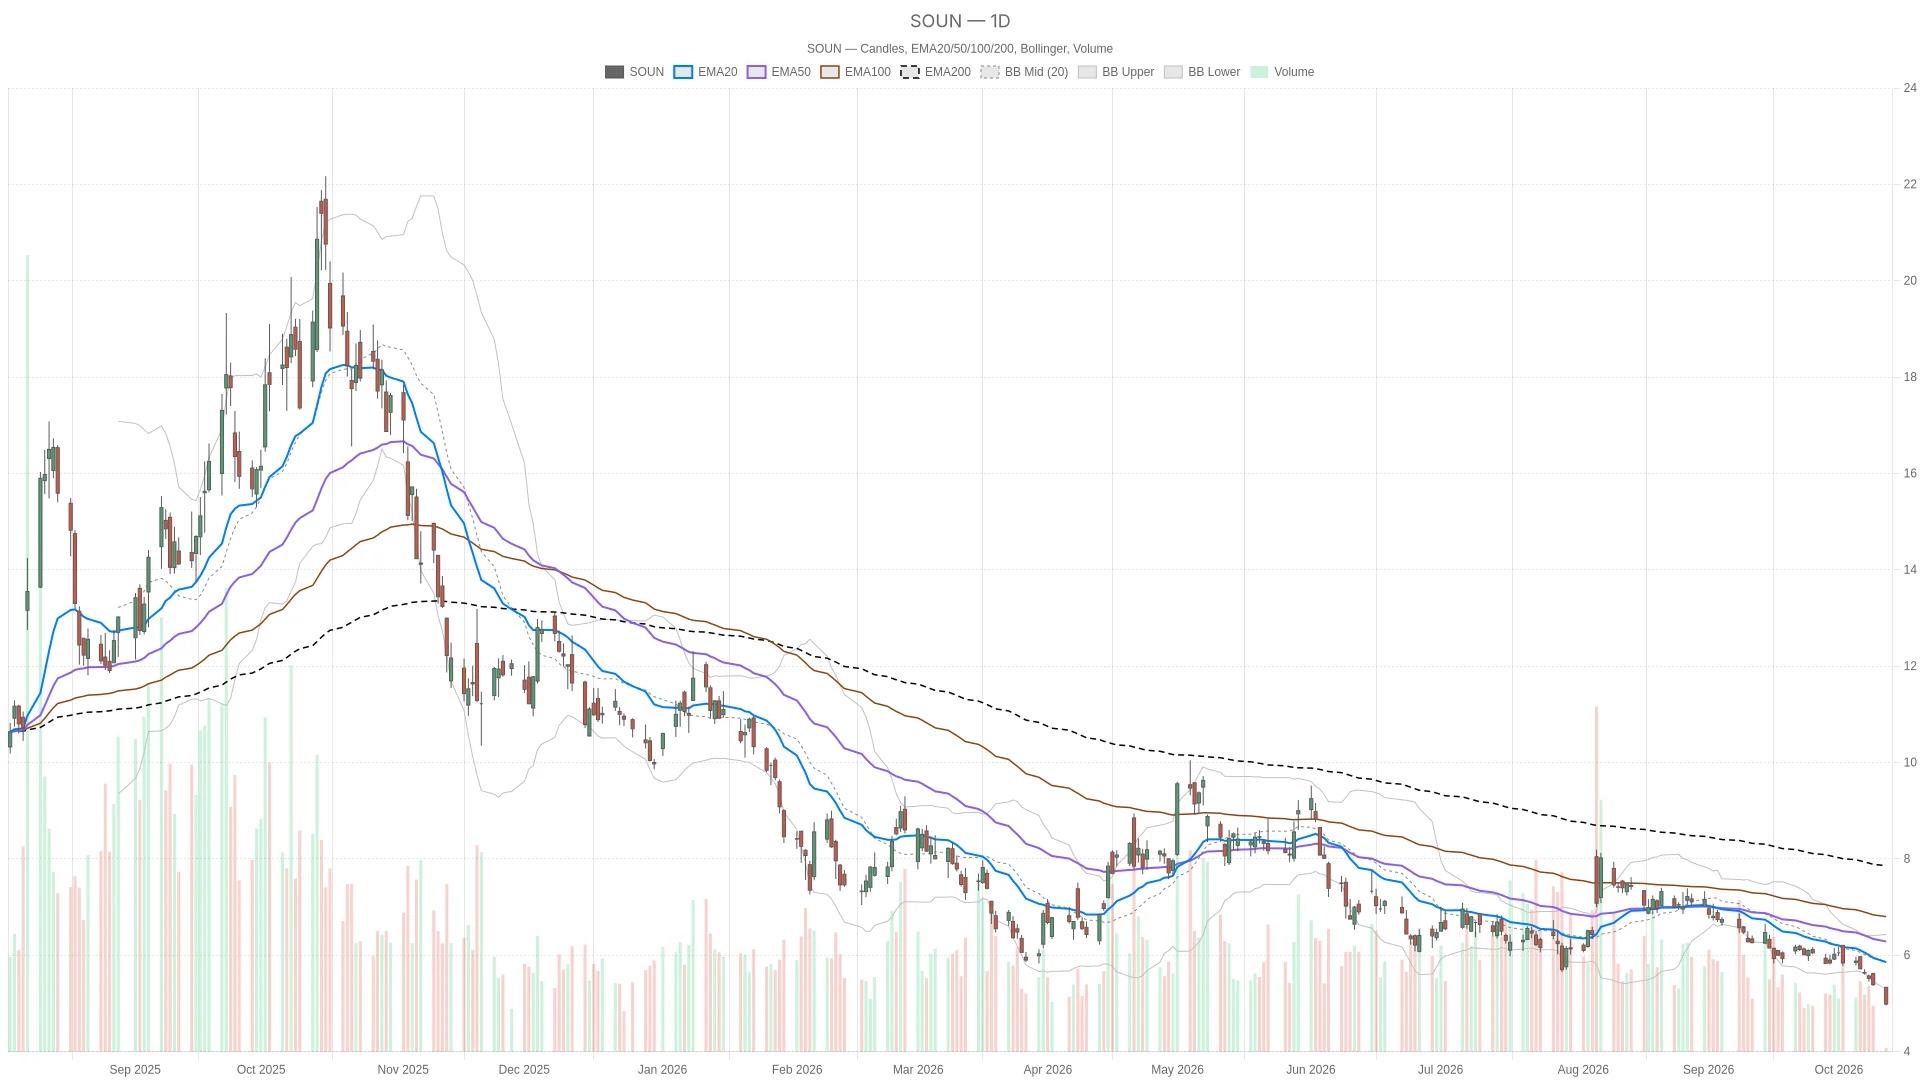
The daily chart of SoundHound AI shows a bearish structure: the stock price is below all three moving average indicators and also below the lower band of the daily Bollinger Bands at $5.29. The daily RSI14 indicator is at 24.13, indicating an oversold area; the MACD indicator is at -0.31, which is below the signal line of -0.25, with a bar value of -0.06.
On the 20th, EMA was at $5.86, on the 50th it was at $6.28, and on the 200th it was at $7.82. The article states that this bearish arrangement not only indicates that the stock price has fallen below a single moving average but also supports the judgment that the overall trend is bearish. The stock price is also below the lower band of the daily Bollinger Bands, which is $5.29, with the middle band at $5.86 and the upper band at $6.43.
It is worth noting that the first support level on the daily chart ( S1 ) is also at $5.29, which is higher than the current stock price. Based on the previous complete daily candlestick, the pivot point on the daily chart is at $5.46, and the first resistance level ( R1 ) is at $5.55. The daily ATR14 has risen from $0.26 to $0.27, indicating that the absolute range of fluctuation is larger than that of the previous candlestick.
Hourly chart confirms a bearish trend.
The hourly chart further strengthens the bearish outlook: the stock price is below the 20-hour EMA of $5.29, the 50-hour EMA of $5.54, and the 200-hour EMA of $6.12. The hourly RSI14 is at 11.49, indicating a deep oversold area; the hourly MACD line is at -0.18, which is lower than the signal line of -0.15.
However, the 15-minute chart has brought about some limited disagreement. The 15-minute MACD indicator value is at a positive 0.01, which contrasts with the bearish readings on the daily and hourly charts MACD. Meanwhile, the 15-minute RSI14 indicator is still in an oversold state, at 20.29; the stock price is below the 15-minute 20-period EMA level of 5.07 dollars, the 50-period EMA level of 5.21 dollars, and the 200-period EMA level of 5.57 dollars.
From a short-term perspective, the stock price is above the lower band of the 15-minute Bollinger Bands at $4.98, but below the middle band at $5.05. At the same time, the stock price is also below the first support level of $5, the pivot point of $5.02, and the first resistance level of $5.03.
On the hourly chart, the stock price is above the lower band of $4.93, but below the first support level of $5.01. The hourly pivot point of $5.02 and the first resistance level of $5.03 are still above. The hourly ATR14 is $0.07, while on the 15-minute chart it is $0.03, reflecting the volatility levels in the two time frames respectively.
Relevant News: Cash Flow Concerns and Platform Expansion
Recent reports on SoundHound AI have focused on concerns regarding cash flow and platform expansion. A report published by Yahoo Finance on Sunday, October 11, 2026, emphasized that although revenue performance exceeded expectations, the company has failed to meet cash flow targets for four consecutive times.
A report published on Saturday, October 10, 2026, by Motley Fool, discussed SoundHound after the LivePerson transaction. The report stated that in the coming quarters, it will be shown whether a broader customer base can be transformed into sustainable growth and greater economic efficiency. Meanwhile, on October 6, 2026, Yahoo Finance reported that SoundHound is set to expand OASYS to include automobiles, televisions, and Internet of Things devices.
SoundHound AI Bull and Bear Scenarios for Stock Prices
The article argues that for the SoundHound AI stock price to form a bullish scenario, it first needs to hold above the intraday low of $4.96 and break through the resistance levels around $5.02 to $5.03. If it can further recover to $5.29, the stock price will once again stand above the lower band of the daily Bollinger Bands and the first support level on the daily chart. Thereafter, the daily pivot point of $5.46 and the first resistance level of $5.55 will become the subsequent key levels. If it can break through the 20-day moving average of $5.86 on the daily chart, that would provide even stronger structural support.
Relatively speaking, if it falls below $4.96, that would weaken the bullish scenario, and the next reference point would be the lower band of the hourly Bollinger Bands at $4.93. If it continues to trade below $5.29, the daily chart pattern will remain bearish. The article states that the oversold reading for RSI can only be considered a limiting factor, and it does not prove that the downward trend has ended.
Overall, the stock price of SoundHound AI is close to the daily low and below the key daily boundary of $5.29. The daily ATR14 level is $0.27, while shorter-term charts provide reference levels in that vicinity. Whether the positive movement in the 15-minute MACD bars will be confirmed by the hourly and daily charts remains to be seen.
Frequently Asked Questions
What are the key price levels to watch for SoundHound AI stock?
The lower band of the daily Bollinger Bands and the first support level ( S1 ) are both at $5.29. The daily pivot point is at $5.46, and the first resistance level ( R1 ) is at $5.55. Below the current price, the intraday low of $4.96 and the lower band of the hourly Bollinger Bands at $4.93 are the next reference levels.
SoundHound AI Is the stock price in a oversold state?
The daily line RSI14 is at 24.13, and the hourly line RSI14 is at 11.49; both are in an oversold range. However, the value of the daily line MACD is -0.06, and the hourly line MACD at -0.18 is below its signal line. Although RSI indicates oversold conditions, the daily line MACD has not yet provided a positive confirmation to support a bullish scenario.
What does the value of the 15-minute MACD column indicate?
The 15-minute MACD bar value is positive at 0.01, which forms a limited divergence from the bearish MACD signals on the daily and hourly timeframes. However, the 15-minute RSI14 is still in an oversold state, at 20.29, and the stock price is below all three 15-minute exponential moving averages. This single positive bar value is not sufficient to establish a bullish trend.
Neither Cryptonomist nor the author holds any positions in the financial instruments mentioned in this text, nor have they received any compensation from the companies reported.
This article was generated with the assistance of artificial intelligence and has been reviewed by an editorial team.