

Key Points
- After failing to hold above the 50-day moving average, the trading price of Cardano fell below $0.22.
- The long-short ratio of ADA is 0.79, which is close to the lowest level in over a month.
- Negative funding rates are displayed, indicating an increased market demand for bearish derivative exposures.
Cardano encounters resistance in rebounding below the key support level
On Thursday, Cardano continued to face pressure, with trading prices below $0.220. Previously, buyers were unable to sustain the rebound that followed a break above the 50-day exponential moving average from the previous day.
This setback has caused ADA to fall below both the 50-day and 200-day moving averages, indicating a still bearish short-term outlook. The price is currently hovering near the 100-day moving average, which is just above around $0.220, meaning that the support level in front of us is within reach.
Weak derivatives positions and low momentum indicate that buyers have not yet built enough strength to reverse this downward trend.
CoinGlass data shows that the long-short ratio of Cardano on Thursday was 0.96, approaching the lowest level in over a month.
The funding rates further confirm this point. The funding rate for Cardano turned negative on Wednesday, reaching -0.0025% on Thursday, which means that short holders are paying a fee to long holders.
Overall, these readings indicate that derivative positions are biased towards bearish sentiment. They do not guarantee that prices will continue to fall, but they also provide almost no confirmation signals for a shift back to bullish views.
The summary data of CryptoQuant also shows that there is selling pressure in the Cardano market. The platform indicates that large whale orders and futures trading have increased, and both the spot and futures markets are dominated by sellers.
A single large order alone cannot determine the direction. However, when they appear alongside stronger selling activities, it further adds to a cautious atmosphere at ADA, where there is resistance from above.
To achieve a stronger rebound, buyers need to absorb this supply and keep prices above the nearby technical resistance levels.
ADA breaks below $0.220, with momentum still weak
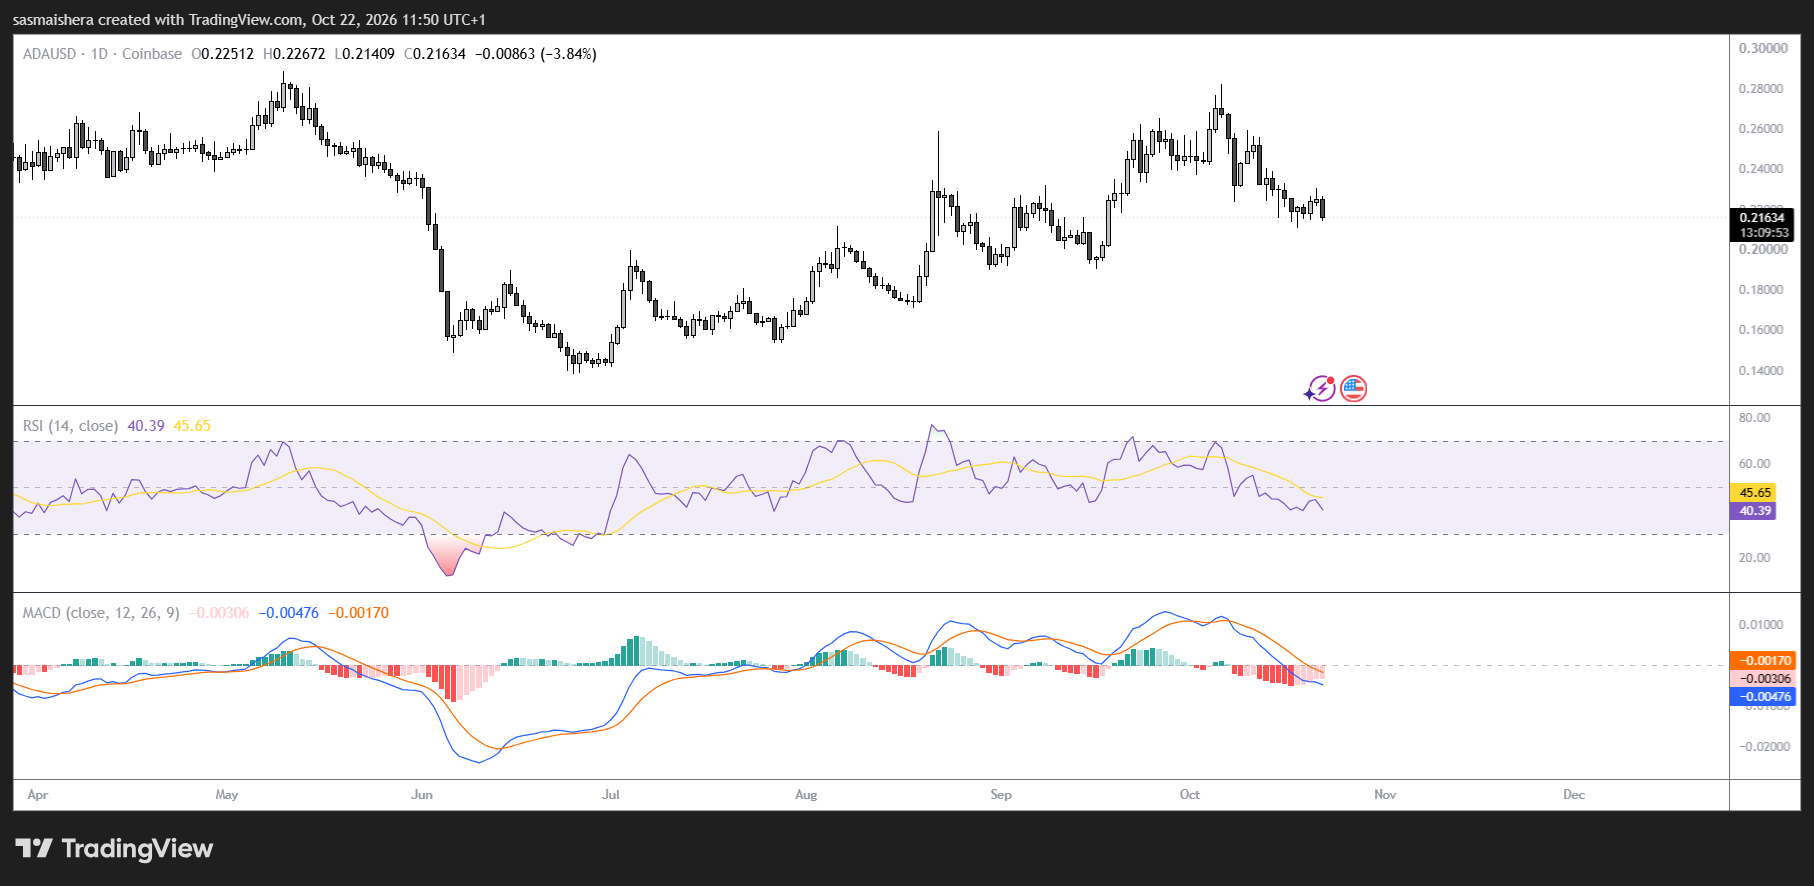
The daily momentum indicator for Cardano remains cautious. The Relative Strength Index (RSI) is still just over 40, below the neutral threshold of 50.
At the same time, MACD remains negative, indicating that the bearish pressure may be weakening, but there has not yet been a confirmatory reversal.
The first support level that needs attention is the 100-day exponential moving average, which is around $0.220. If it continues to fall below this level, the $0.210 region will come into view.
If selling pressure continues to extend below $0.210, the chart indicates a deeper support level around $0.170. However, this is still a scenario that depends on the loss of support at the nearer levels.
On the upside, the range of $0.228 to $0.230, where the 50-day moving average is located, constitutes the first resistance level for a rebound. If the price can remain above this area, short-term pressure will be alleviated, and market attention will shift to the resistance level around $0.236, followed by the 200-day moving average at approximately $0.240.
Further resistance levels are around $0.250; if a broader rebound occurs, $0.300 would be a more distant target level.
For now, whether ADA can hold above $0.220 remains the key to its short-term outlook. Bearish derivative positions and weak momentum are limiting any attempts at a rebound.