

On August 27, Bitcoin remained around $79,500, having rapidly risen from around $63,000 earlier on. In the past week, the price has increased by approximately 25%. The price once surpassed $80,000, but encountered significant selling pressure in the range of $81,000 to $82,000, leading to a short-term consolidation phase.
ETF Capital reflux supports a rebound
The reinflow of funds into spot Bitcoin in the United States ETF is an important support for this round of gains. SoSoValue Data shows that as of the week of August 21, the total net inflow into listed spot Bitcoin ETF in the U.S. was approximately $1.92 billion, of which BlackRock IBIT contributed about $1.33 billion.
This is also the strongest week for such products since October 2025. However, looking at the whole year, these funds still experienced a cumulative net outflow of about $2.91 billion in 2026, indicating that although institutional funds have clearly flowed back, the weaker performance throughout the year has not yet been completely reversed.
US policy expectations are also improving market sentiment. Reports mention that Trump has once again called on Congress to advance legislation on the structure of the crypto market, and such statements have raised market expectations for an improvement in the regulatory environment.
U.S. Treasury Department actions drive risk appetite
The market is also paying attention to the support arrangements for the liquidity of long-term government bonds by the US Treasury Department. On August 19, the US Treasury Department announced that it would increase the single maximum amount for long-term government bond repurchase operations from $2 billion to at least $4 billion, involving bonds with maturities of 10 to 20 years and 20 to 30 years.
This arrangement will commence on September 9th and last until November 4th. Although this does not equate to an immediate injection of new funds into the market, it has raised market expectations for the liquidity of U.S. Treasury bonds and has also indirectly improved the sentiment towards risk assets.
Clearing activity is intensive above $81,000.
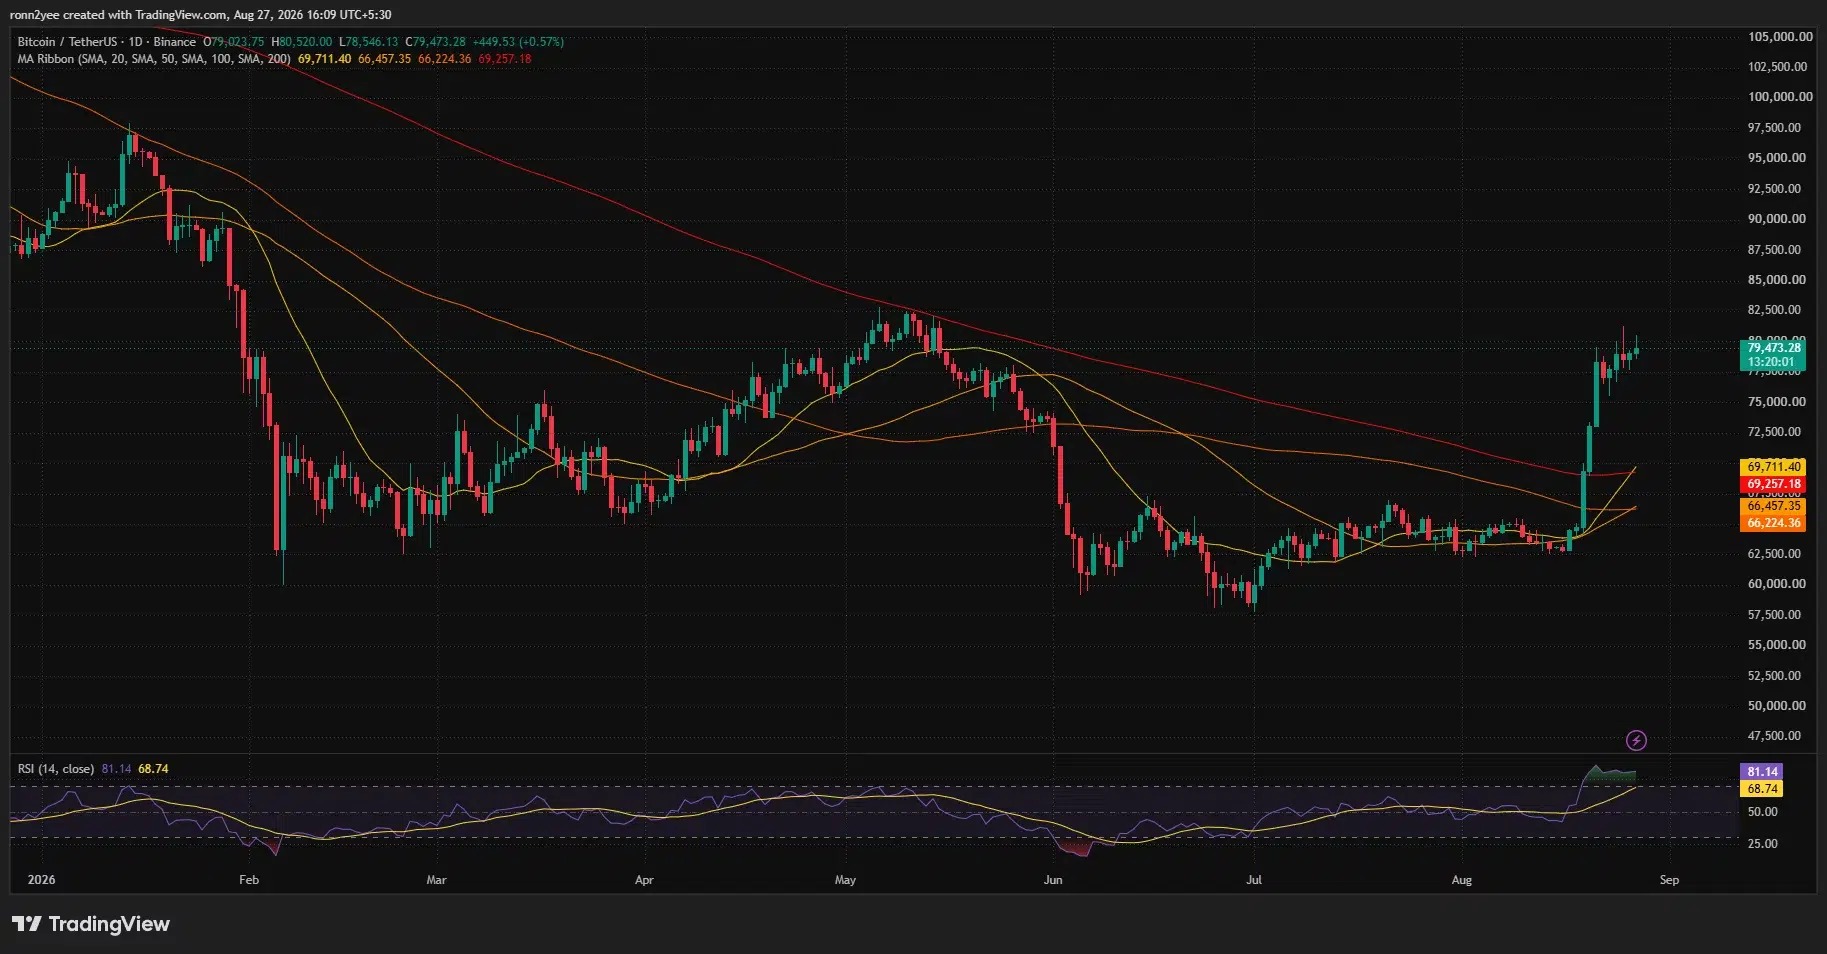
From a technical perspective, Bitcoin has currently crossed several daily moving averages. The 20-day moving average is around $69,700, the 200-day moving average is around $69,300, and the 50-day and 100-day moving averages are near $66,500 and $66,200, respectively. Maintaining these levels indicates that the medium-term recovery trend continues.
However, signals of short-term overheating are also accumulating. The daily RSI has risen to 81.14, significantly above the common overbought threshold of 70, indicating strong buying momentum, but it also means that the pressure to take profits may increase.
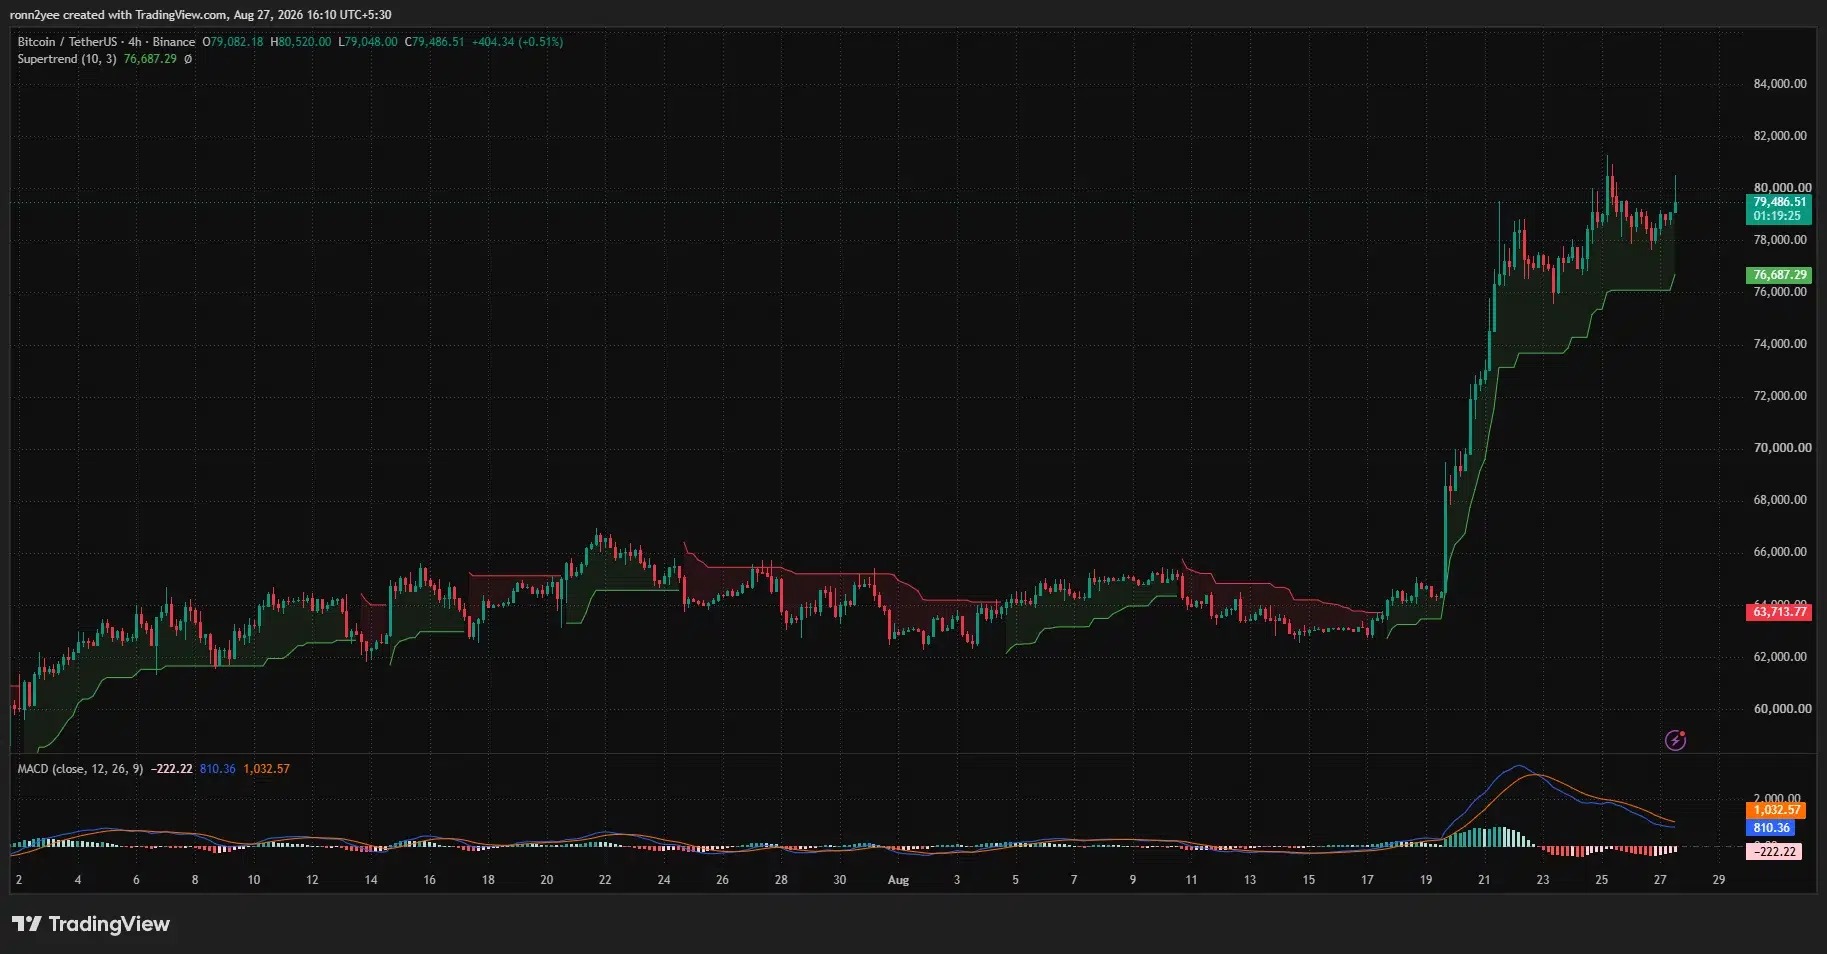
On the 4-hour chart, the support level corresponding to the Supertrend indicator is around $76,700, and the price is still above that level. Meanwhile, there are signs of short-term weakness in MACD, indicating that the upward momentum has slowed down compared to before.
The CoinGlass one-week settlement heat map shows a relatively dense short-selling settlement area above $80,000 to $81,000. If the price effectively breaks through this area, it may further drive up the market and test the liquidity around $81,500 and $84,000.
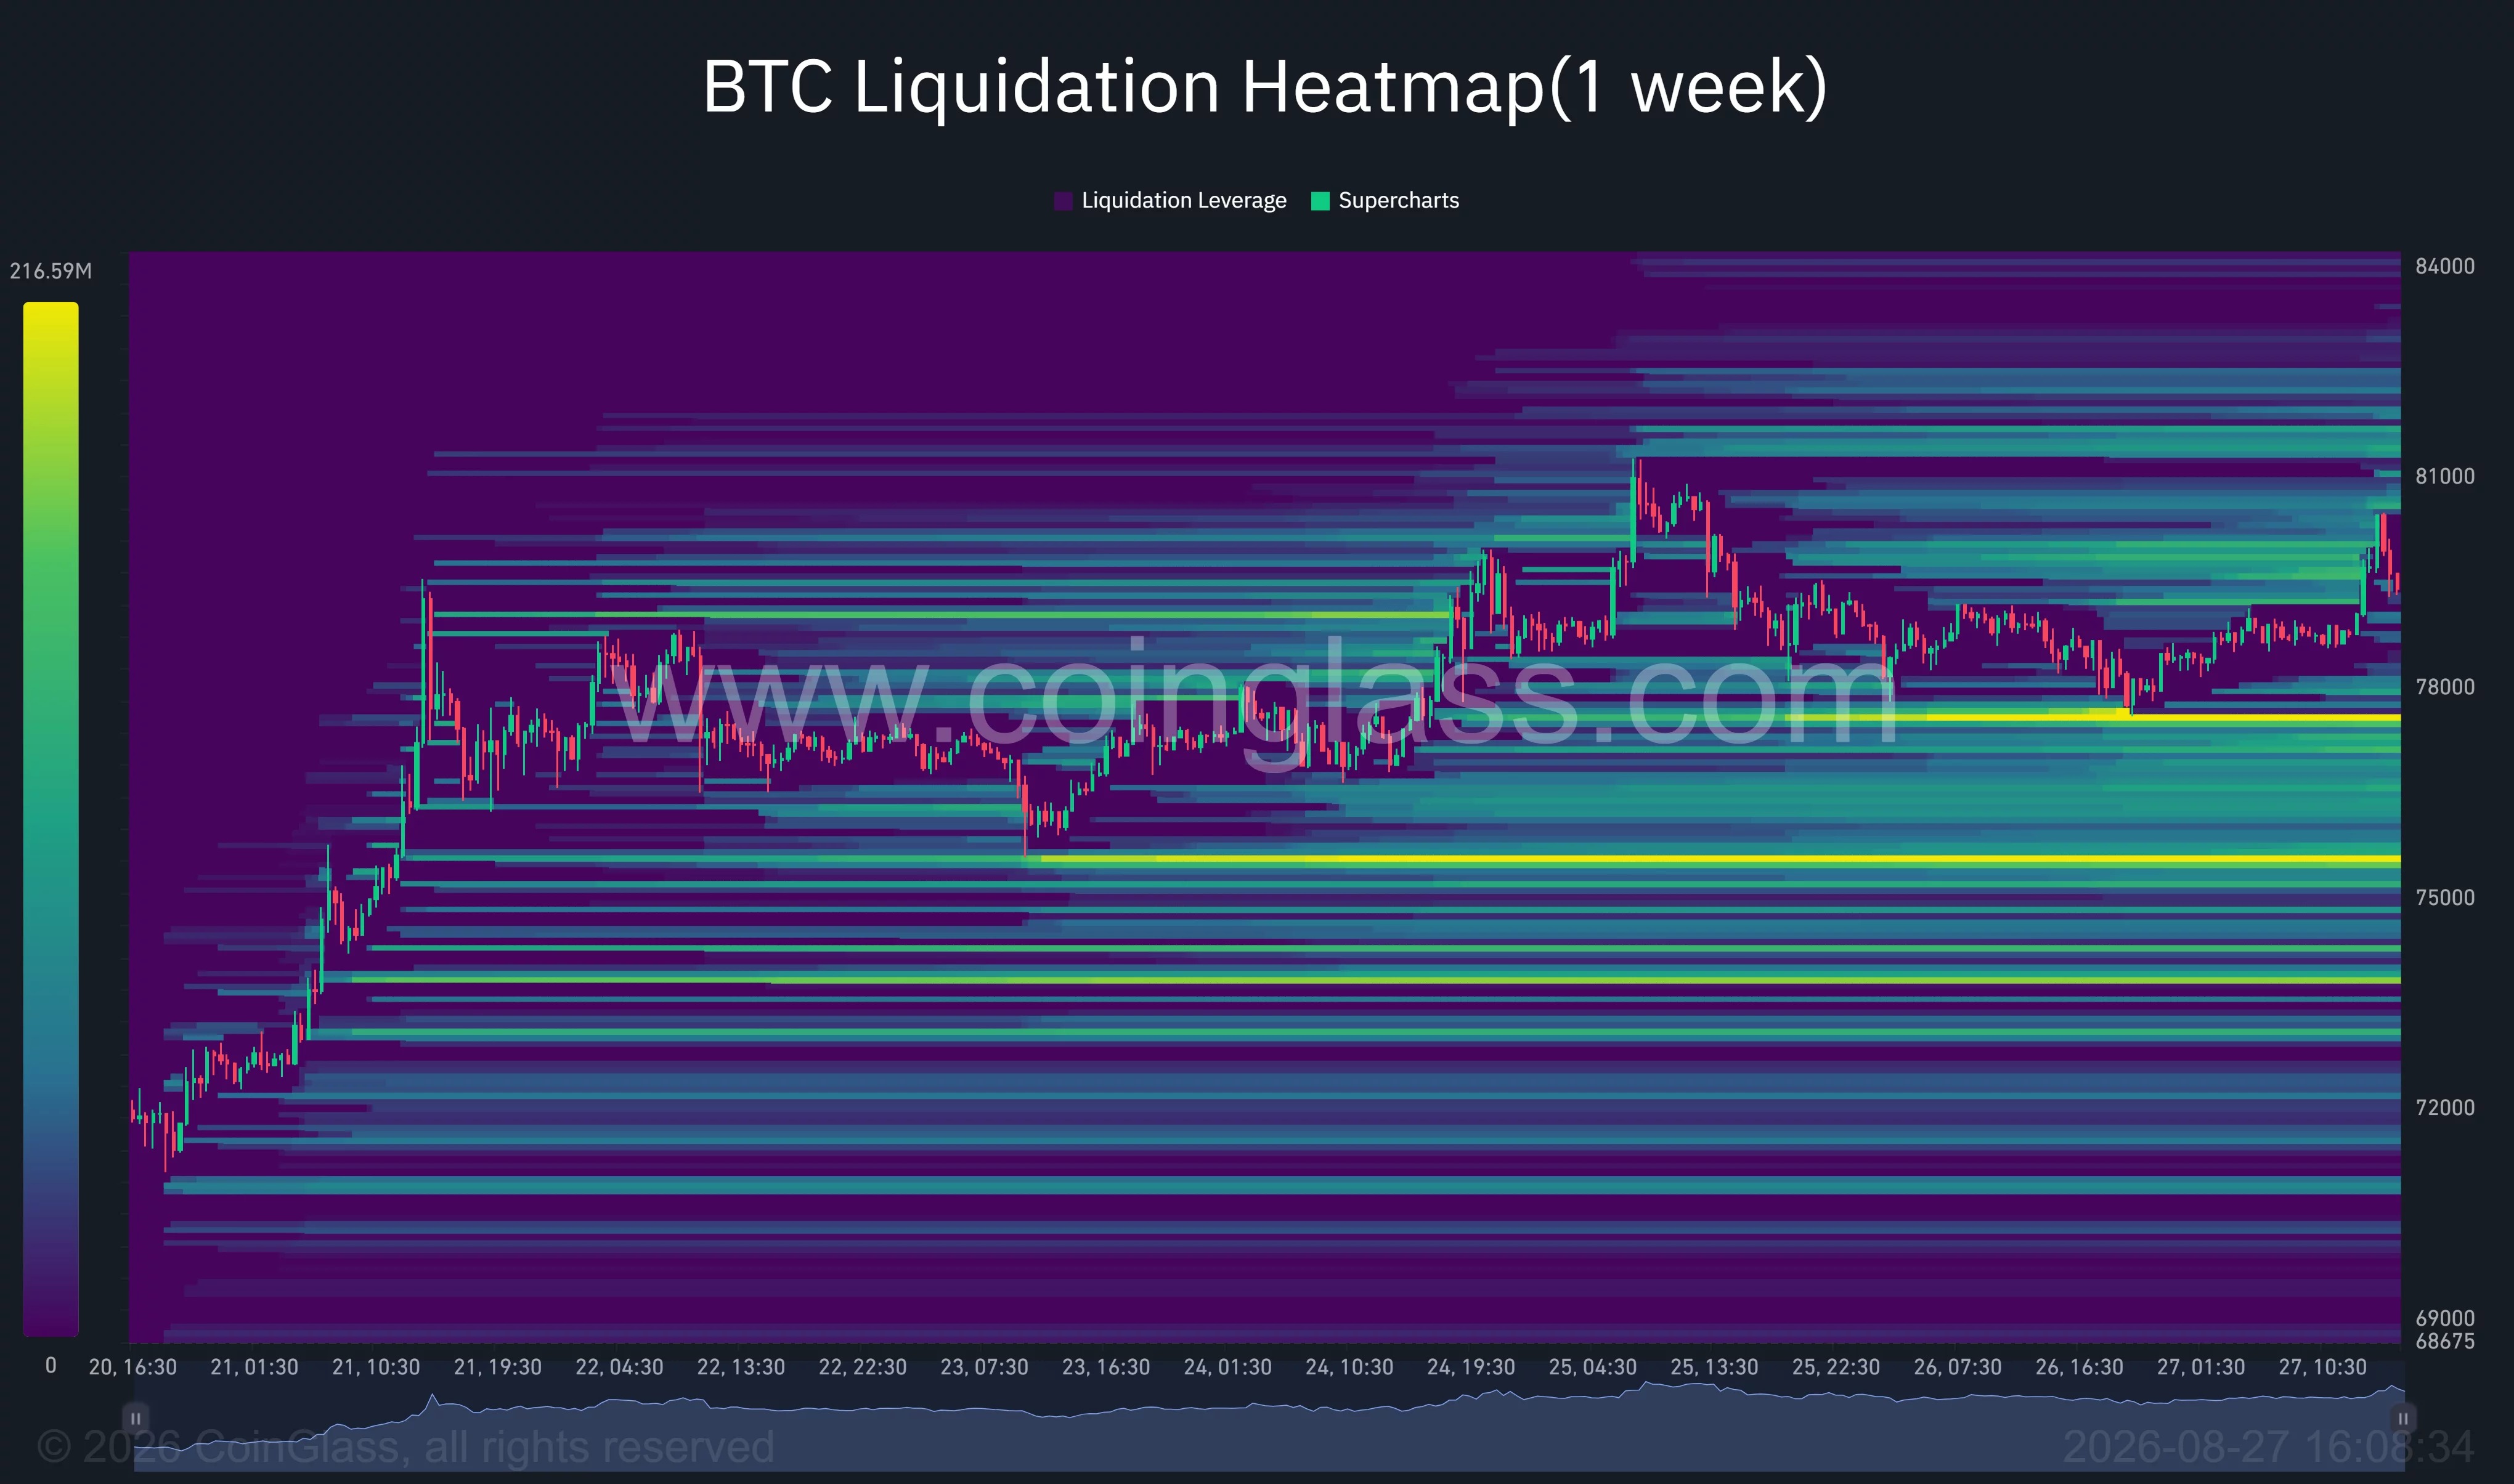
The focus below is mainly on the ranges of $77,300 to $77,700 and around $75,500. If Bitcoin loses support in the current consolidation range, the market may revisit these levels. The report also mentions that the cost level for short-term holders is around $75,900, and this level is becoming an important reference for short-term trading strategies.