

Ethereum remained above $2,500 on August 27, continuing the high-level consolidation following its breakout last week. The factors driving this round of gains mainly include a strengthening inflow of ETF funds into spot Ethereum in the United States, improved liquidity expectations due to the U.S. Treasury Department's expansion of long-term Treasury bond repurchase programs, and large-scale short covering in the derivatives market.
ETF Capital flow supports spot prices
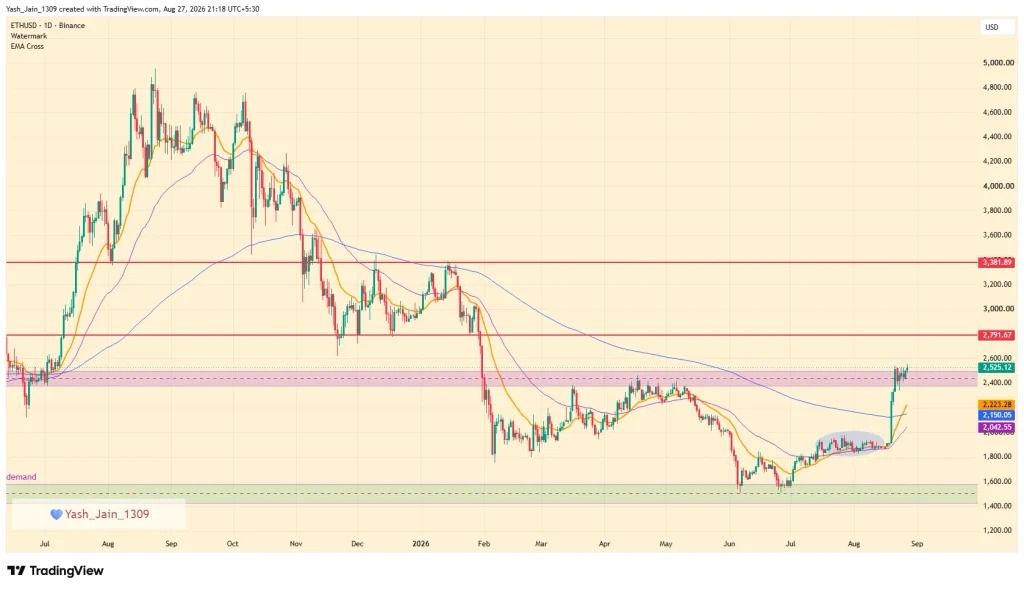
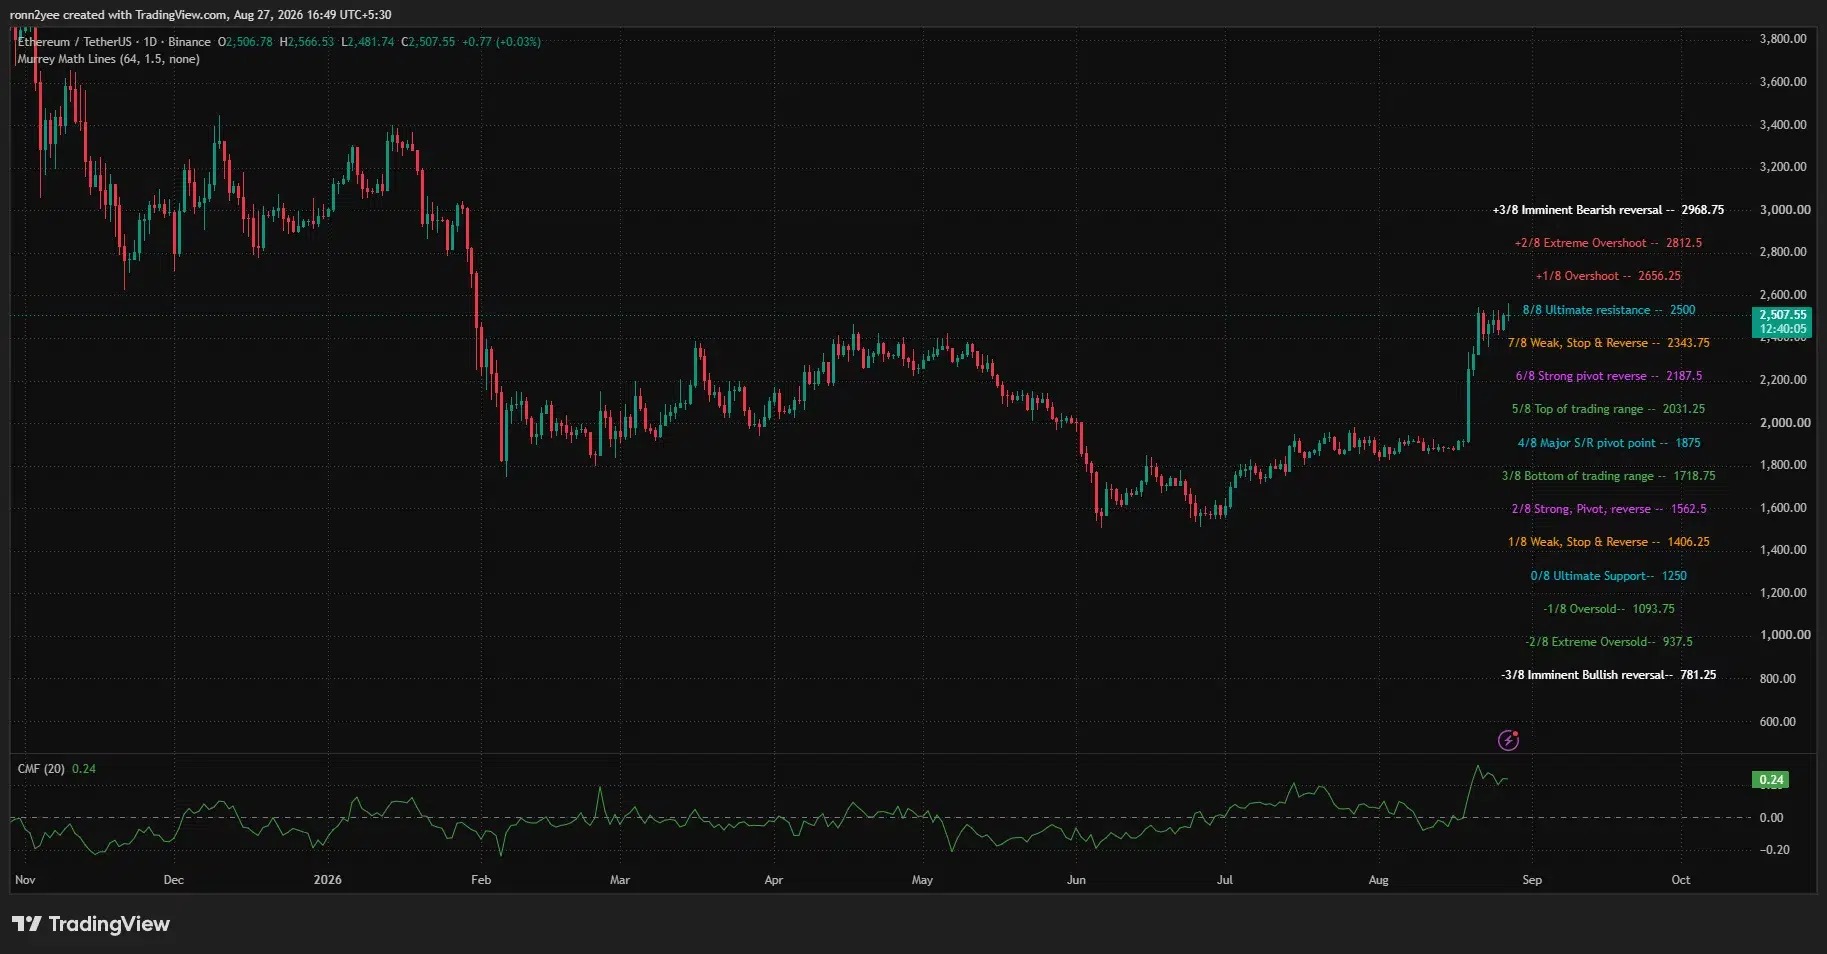
As of press time, ETH is trading at $2,507, up approximately 7.8% from the opening price of $2,326 on August 21, and once reached around $2,566 during the session. Previously, ETH had been fluctuating in the range of $1,875 to $1,950 for a long time, before breaking through upwards and surpassing the integer mark of $2,500.
U.S. spot Ethereum ETF recorded a net inflow of approximately $697.2 million in the week ending August 21, marking its strongest single-week performance since 2026. During the same period, Bitcoin and Ethereum funds listed in the U.S. attracted a total of about $2.6 billion in capital inflows. As funds continue to flow into spot products, this provides more stable buying support for ETH after a rapid rise.
Macro liquidity resonates with short covering
The starting point of this round of gains occurred after the U.S. Treasury Department announced an expansion of long-term liquidity support for treasury bond repurchases. According to the arrangement, starting from September 9th, the maximum amount per transaction will be increased from $2 billion to $4 billion, covering U.S. treasury bonds with maturities of 10 to 20 years and 20 to 30 years.
The market generally views this adjustment as a positive for liquidity-sensitive assets. At the same time, there was a large-scale short squeeze in the derivatives market. Within 24 hours, approximately $3 billion in leveraged positions in the crypto market were liquidated, of which about 92% were short positions. ETH once rose by about 18% during this process, and the forced closing of short positions further amplified the increase.
Around $2,550 is a short-term focus.
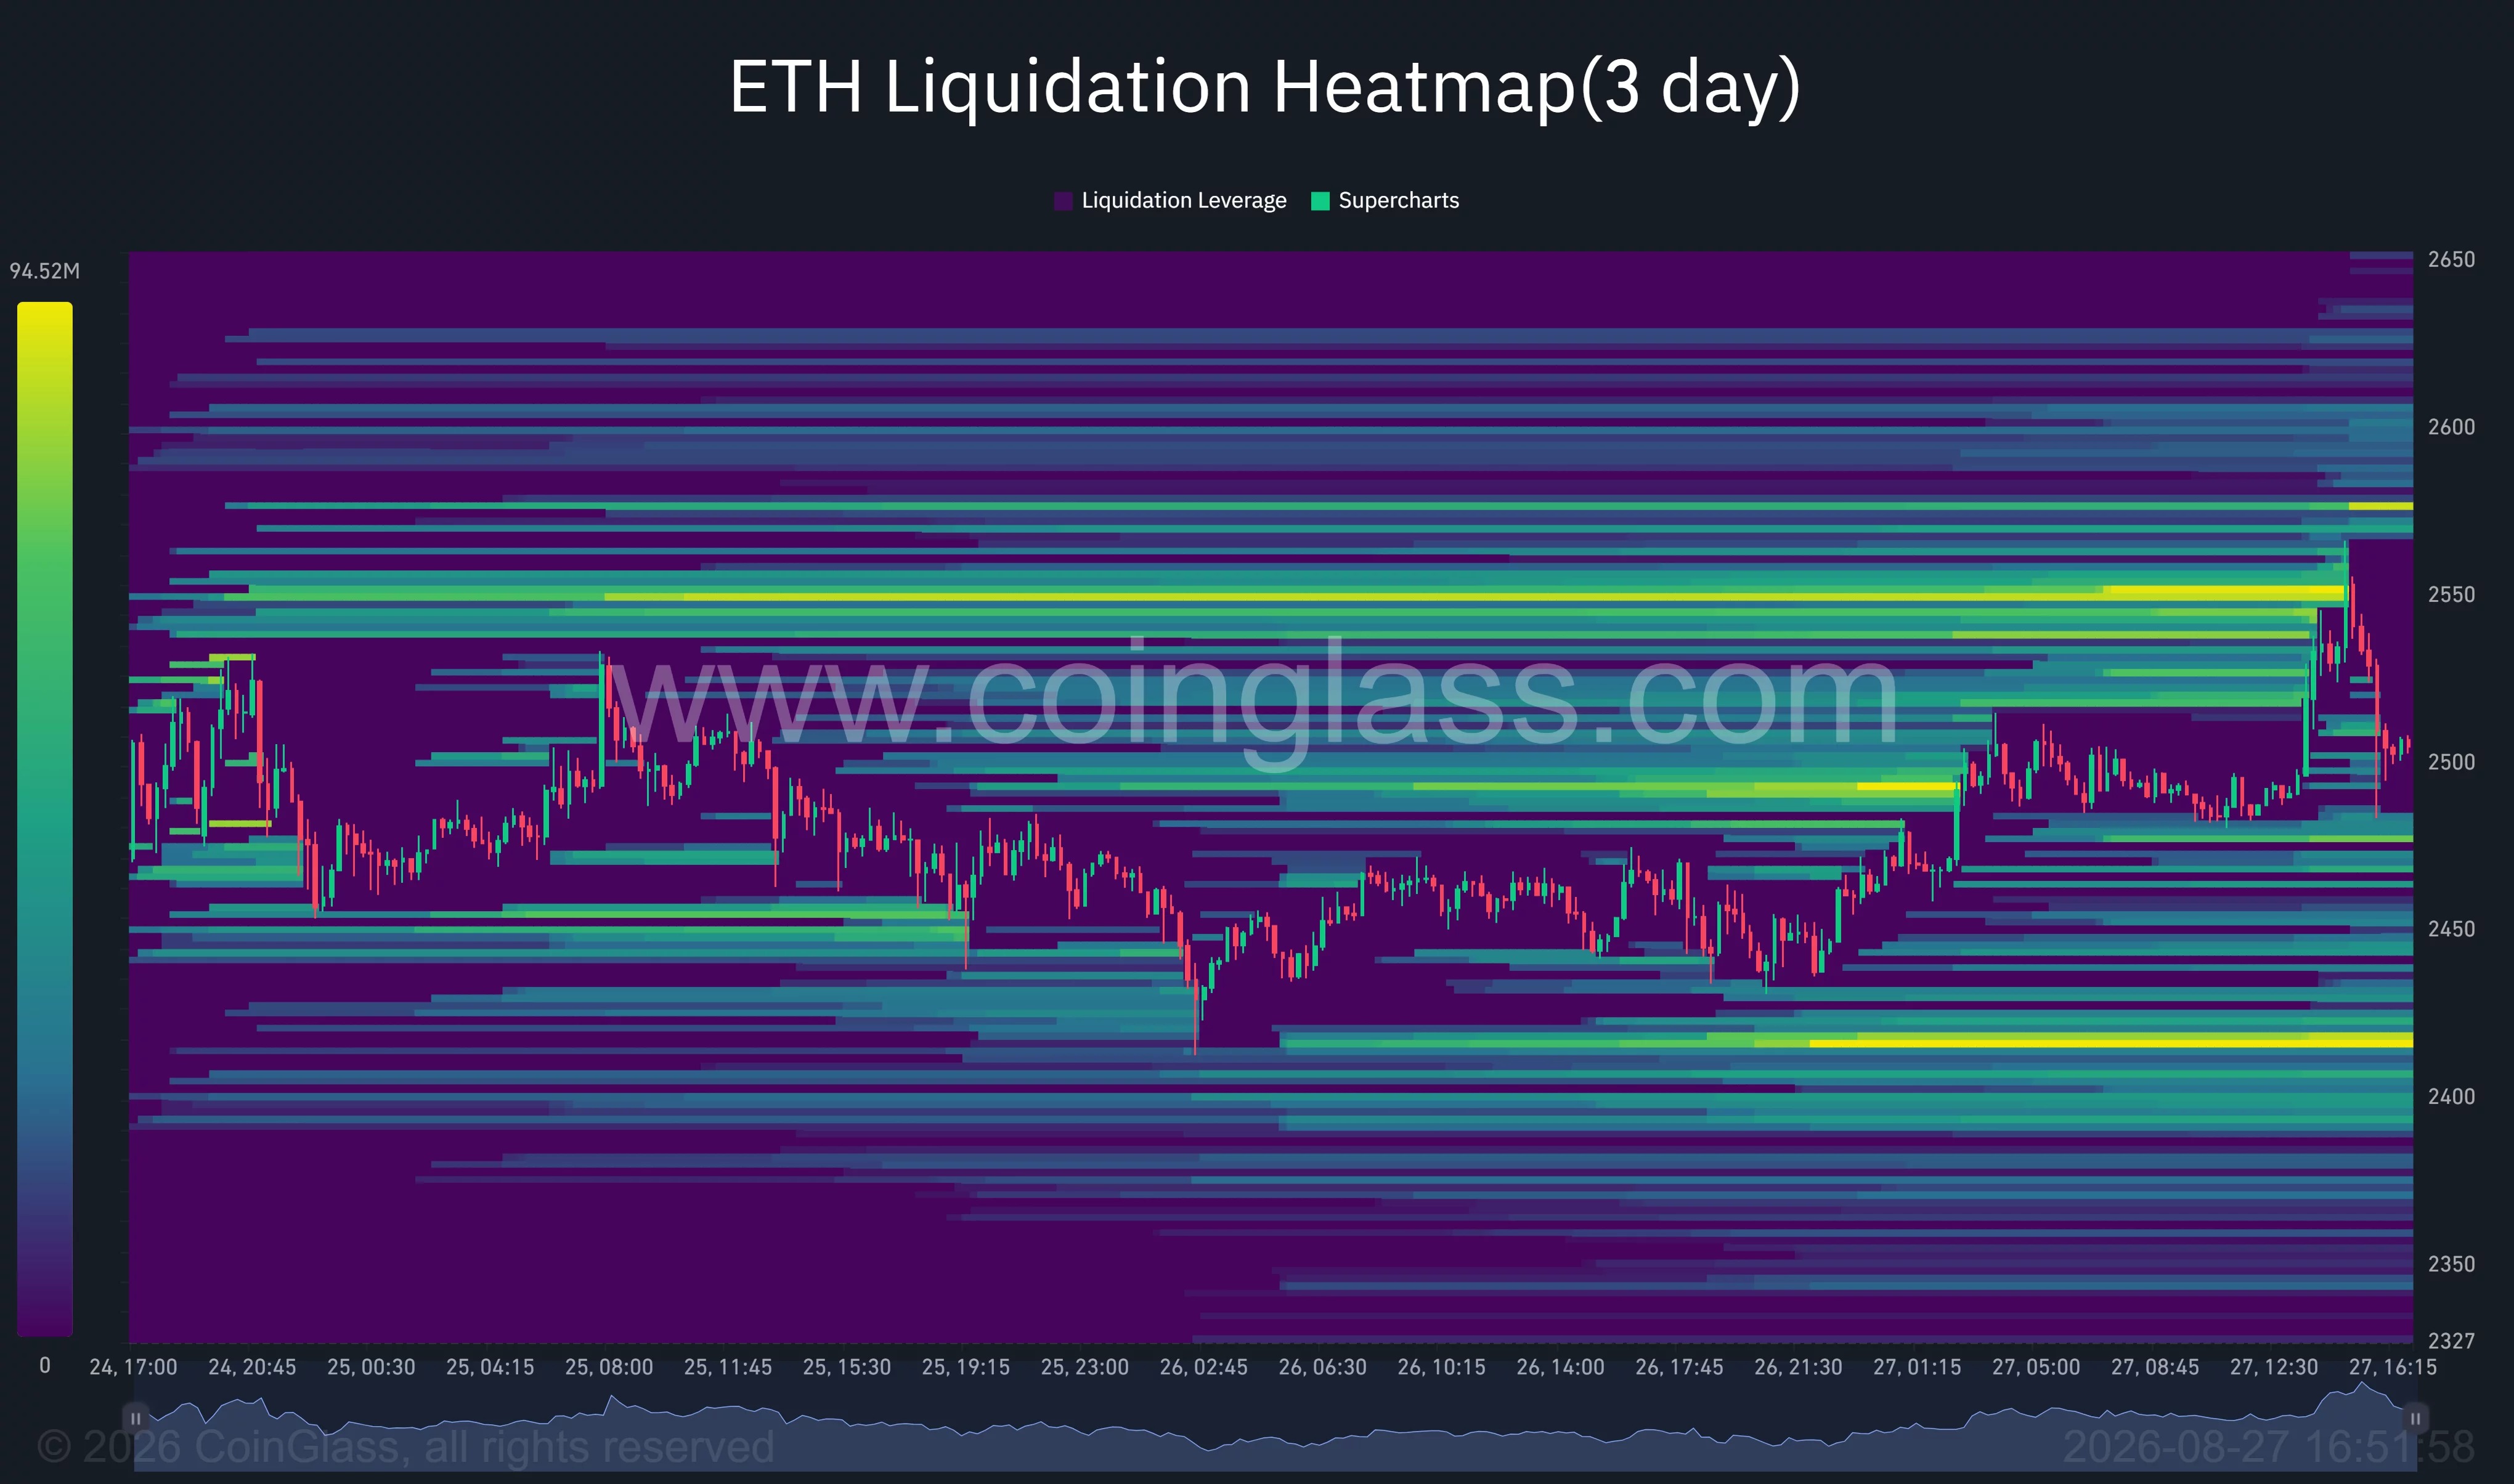
From a short-term perspective, the area around $2,550 is becoming the first pressure zone that the market is paying attention to. The three-day clearing heat map by CoinGlass shows that there are a significant number of leveraged positions concentrated in the range of $2,545 to $2,555. If prices continue to rise, this area may be the first to come under test.
If there is a valid breakthrough above $2,550, the liquidity between $2,575 and $2,600 is relatively thin, and prices may move more quickly towards $2,656. If the momentum continues to expand, the market will also pay attention to levels around $2,812 and close to $3,000.
However, the same risks exist below as well. Data shows that there are also significant clearing concentration areas around $2410 to $2420, with closer support levels at around $2477 and $2441. If these positions are lost, ETH may retreat to areas with even less liquidity.
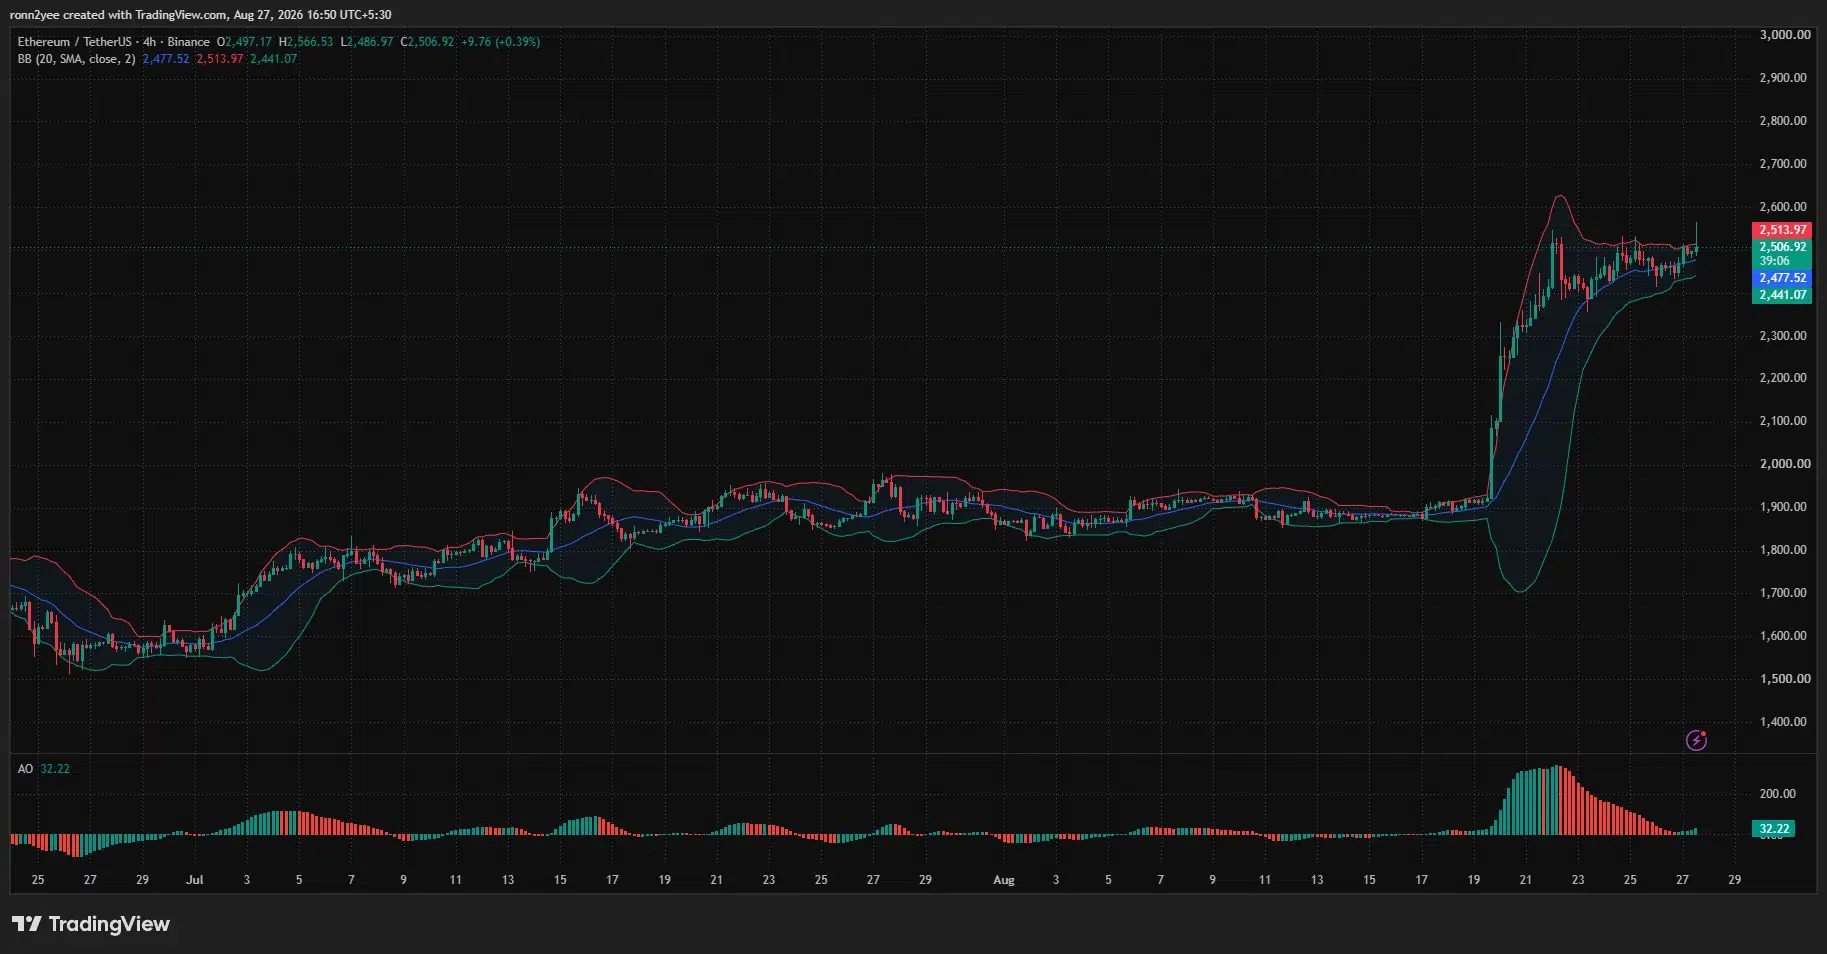
Analysts are currently more concerned with whether the price can remain above $2,550 at the close of this week. If the weekly chart holds steady, it indicates that the buying momentum in the spot market will continue after the short sellers cover their positions; if the price falls back below $2,441, it may signify that this round of gains is entering a deeper adjustment phase.