

When will the next round of crypto bull market arrive?
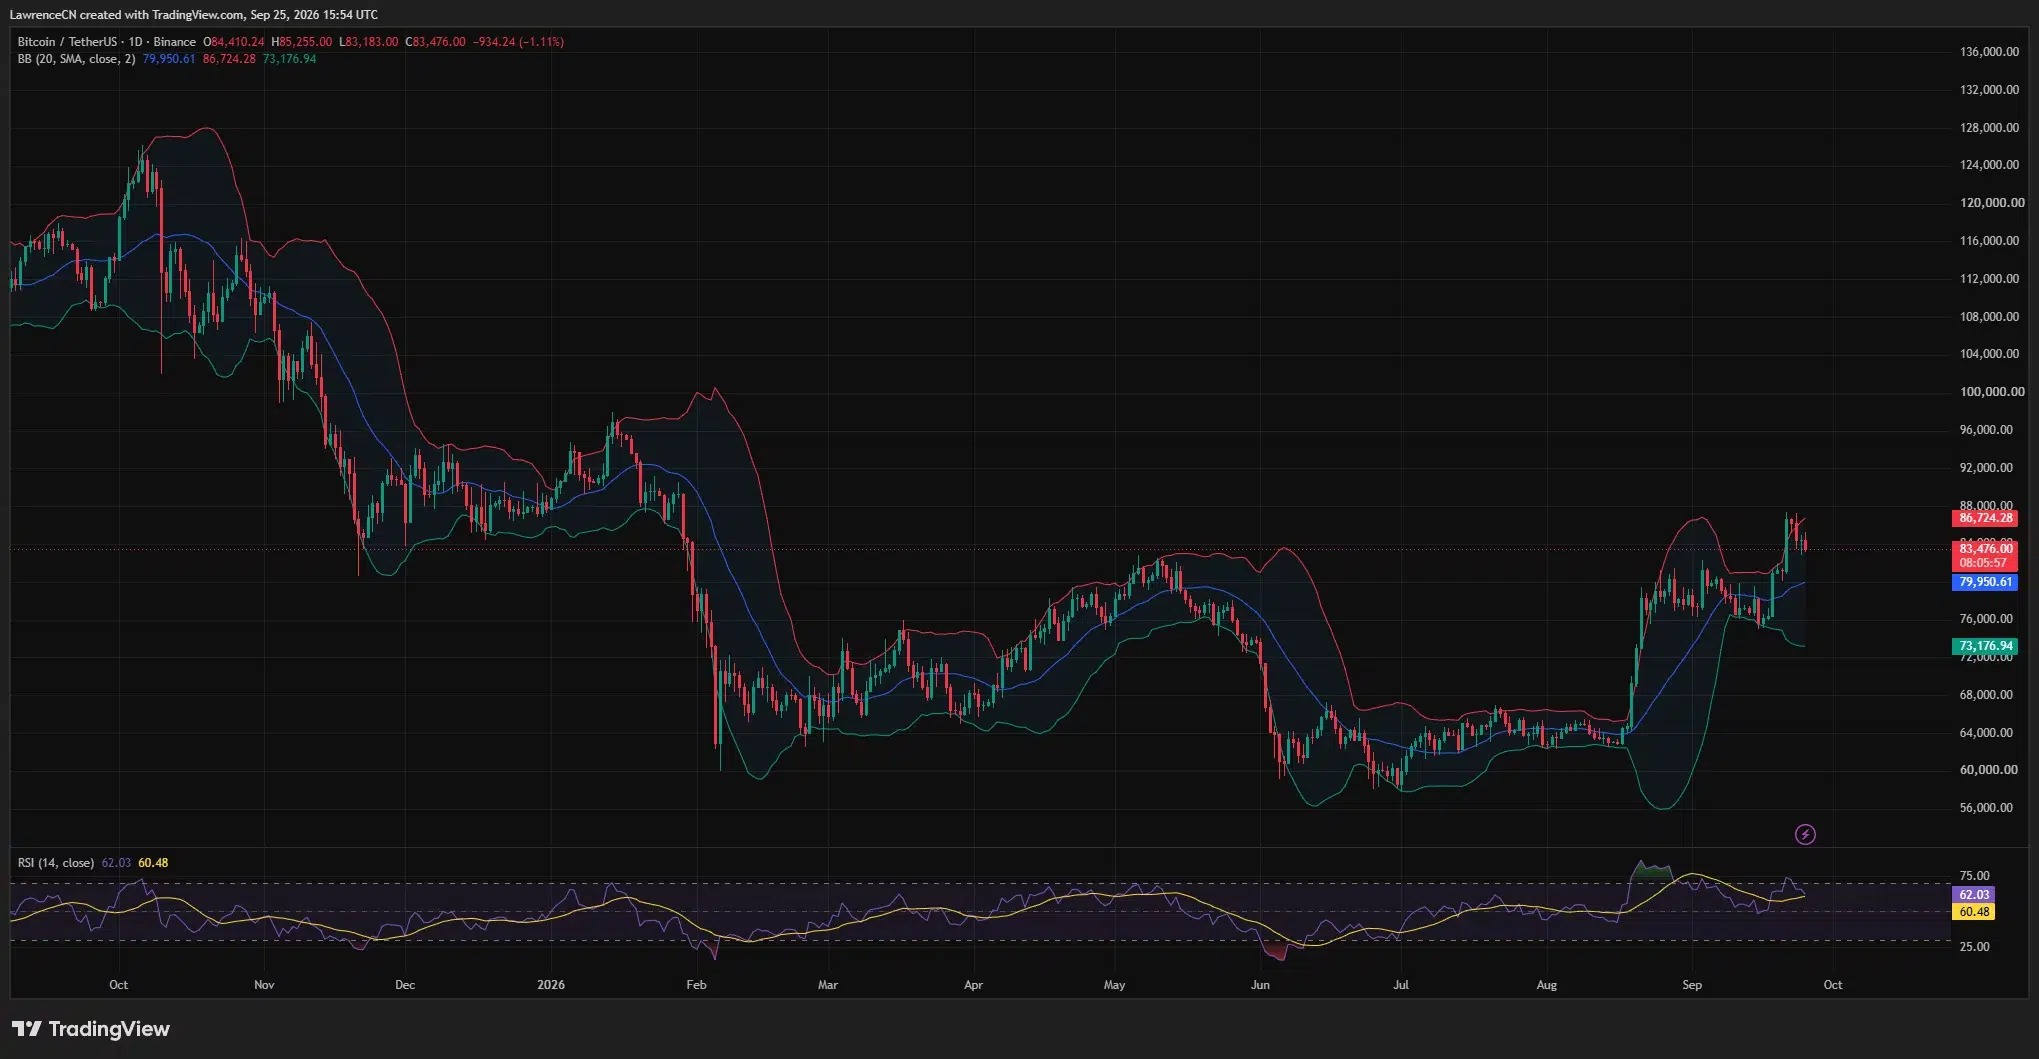
Bitcoin has rebounded to the middle of the $85,000 range, and the total market value of the global crypto market is once again approaching $3 trillion. However, the rise in Bitcoin prices alone does not prove that the entire market has entered a bull market. ETF Inflation data in October and the Federal Reserve's interest rate meeting dates provide points of inspection, rather than a pre-determined starting point. Capital inflows, spot demand, and increases in a broader range of assets beyond a few major tokens must all continue to occur simultaneously.
- On October 5th, CoinGecko listed the total market value of the global crypto market at nearly $2.98 trillion, with Bitcoin accounting for about 57% of that value.
- According to CryptoQuant, from September 24th to October 1st, its "apparent Bitcoin demand" indicator improved by approximately 81,000 BTC, but it remains in negative territory.
- U.S. spot Bitcoin ETF saw a net inflow of $2.39 billion from September 21 to 25, but on September 30, it recorded a net outflow of $148.7 million.
- The U.S. CPI for September will be announced on October 14th, while the Federal Reserve will decide on interest rates on October 28th. The PCE for September is scheduled to be released on October 29th.
- To confirm a sustained bull market across the entire market, it is necessary to see a simultaneous increase in the value of non-stable coin assets and spot demand over several weeks, rather than just one instance of high prices.
After Bitcoin's rebound in the third quarter, the total market value of the crypto market once again approached $3 trillion. However, based on current data, a clear starting point for the next bull market is still not visible. The global market page for CoinGecko shows that as of October 5th, the total market value was approximately $2.98 trillion. Its market value distribution chart indicates that Bitcoin accounts for about 56.9% of the total market value, while stablecoins account for around 9.8%. These proportions indicate that the market is still dominated by Bitcoin, and there is also a considerable base of US dollar-denominated tokens. However, based solely on these data, it is not possible to determine whether buyers are widely accumulating high-risk crypto assets.
The demand analysis for CryptoQuant shows that its 30-day "apparent Bitcoin demand" indicator improved from approximately -182,000 on September 24 to approximately -101,000 on October 1. The reduction in demand was about 81,000 units, but it has not yet turned positive. Analysts also pointed out that the premium over the cost of production (Coinbase) remains negative. It is possible for a price rebound to occur while the estimated demand remains negative; however, this discrepancy is precisely the issue that must be resolved to support the claim that a "bull market has begun."
Rebound and a bull market answer different questions.
A rebound describes an upward movement in prices over a certain period of time. A bull market, on the other hand, implies continuity and breadth. For example, if Bitcoin rises by 2% after the release of employment data, even if it pulls back the next day, that is still just a rebound. A full-market bull market requires prices to continue to rise, supported by buyers who remain in their positions over time, and other sectors of the asset class must also participate. Moreover, this participation cannot be limited to just a few trading sessions. No regulatory agency or exchange will announce an “official opening bell” to signal when a bull market begins.
For the purposes of this article, a testable definition of a "good signal" is as follows: the weekly closing price remains higher for four consecutive weeks, the total value of the unstable coin market continues to rise, Bitcoin maintains its gains, and there is evidence in the form of fund inflows or estimated spot demand to support this trend. This four-week period is merely an observational window for editorial purposes and does not represent a market law. It allows for the exclusion of short-covering activities and day-trading speculation while still providing the possibility for timely evaluation. If different definitions are used, the starting point for the same cycle may vary, and this should be clearly stated when comparing predictions.
Bitcoin can lead the rise without the simultaneous surge of altcoins. During many recovery phases, investors first buy into the largest and most liquid assets. However, the term "crypto market" mentioned in the title is not just discussing whether BTC will rise on its own. If Bitcoin rises while the rest of the market remains flat or declines, then a more accurate description would be that "Bitcoin has entered a bull market phase." This could be a prelude to a broader upward trend, but that has not yet truly occurred.
The context of 2026 also shows that it is easy for the market to confuse “scale” with “stage.” According to previous market records, Bitcoin exceeded $126,000 in October 2025, while it is currently around $85,000, which is still far below that high point. It did experience a strong rise in the third quarter of 2026. Both observations can be true at the same time: on one hand, there was a significant rebound from the mid-low point, and on the other hand, the price is still below the previous high. Whether to label the entire market as a new bull market depends on the definition of the starting point and the measure of its breadth, rather than just by how many percentage points it has rebounded from the low point.
A previous analysis for the 2026 cycle discussed various perspectives regarding the “four-year cycle,” ETF, and macroeconomic policies. That article provided a historical context in June. By October, the market was facing a new set of fund flows, employment reports, anticipated inflation data, and Federal Reserve decisions. New conclusions should be drawn based on these observations, rather than simply repeating the calendar year or halving cycles.
After excluding stablecoins, the breadth test will change.
The so-called Bitcoin market share is typically calculated by dividing Bitcoin's market value by the total market value of the entire tracked crypto market. According to the snapshot from October 5th by CoinGecko, Bitcoin accounts for about 56.9%, stablecoins account for about 9.8%, and the global total market value is approximately 2.98 trillion US dollars. Based on these rounded percentages, Bitcoin's corresponding market value is about 1.70 trillion US dollars, while stablecoins amount to about 292 billion US dollars. Since the update times for these input data are not completely consistent, the real-time Bitcoin market value may vary slightly.
After deducting stablecoins and Bitcoin from the rounded total global market value, other crypto assets amount to approximately $985 billion: that is, $2.98 trillion minus about $1.70 trillion, and then minus about $0.292 trillion. This is a broad estimate of the total value and does not represent the actual capital invested on that morning. It includes Ethereum as well as thousands of tokens with varying liquidity levels. The usefulness of this calculation is that an increase in the supply of dollars-pegged tokens may push up the total market value of the crypto market, but it does not necessarily mean that the prices of any high-risk tokens will rise.
The denominator issue can also have effects in two directions. If the scale of stablecoins grows while the value of Bitcoin and altcoins remains unchanged, then the proportion of Bitcoin may decrease, even if no one switches from BTC to altcoins. If only Bitcoin's value rises, then its proportion may also increase, even if the Bitcoin market remains sideways. Therefore, if someone claims that "a decrease in Bitcoin's proportion proves the arrival of the altcoin season," one should also examine the absolute dollar value and price of the non-stablecoin asset group.
Another ratio excludes stablecoins from the denominator. According to the aforementioned rounded snapshot, Bitcoin accounts for approximately $1.7 trillion out of a total market value of $2.688 trillion for non-stablecoins, which is about 63%. This figure is higher than the commonly mentioned 56.9% because stablecoins no longer constitute a part of the denominator. These two figures are not competitive estimates of the same indicator; rather, they answer different questions. To observe whether the upward trend is spreading, it is necessary to consistently use the same measurement over time series.
Caution should also be exercised regarding encapsulation, cross-chain bridging, and staked derivatives. CoinGecko states that in order to limit double counting, certain tokens supported by crypto assets will be excluded from the global market capitalization. Other data trackers may use different coverage ranges or classification methods, which could lead to different total values. If conducting a four-week breadth test, one should not combine data from different providers, nor should the encapsulated versions of the same underlying asset be counted twice without clarification.
To confirm a bull market across the entire market, the total volume of assets other than Bitcoin and stablecoins should continue to rise over multiple weekly observations, and it would be preferable if this increase is not driven by a single coin. An index weighted by liquidity, or a basket of fixed-large-cap coins, can also serve as a supplement to the total volume indicator. Delistings, new listings, or adjustments to the supply volume can all change the total market capitalization without a corresponding increase in the prices of existing holdings; therefore, it is also necessary to monitor the prices of the constituent assets.
Fund flows can reflect demand, but timing is very important.
The Farside US Bitcoin ETF data series shows that as of the week ending September 25, there was a net inflow of approximately $2.39 billion. The same table also indicates that on September 30 there was a net outflow of $148.7 million, and on October 1 there was a net inflow of $102.7 million. The latter two settled trading days resulted in a total net outflow of $46 million. Compared to the inflow volume of the previous week, this reversal is not significant, but it breaks the assumption that "there would be new funds entering every trading day in October."
Upon reviewing this document, the public real-time trackers displayed inconsistent totals for October 2nd, and one row in a table was missing a major component fund. The absence of a report for a particular fund does not equate to zero traffic. Before incorporating Friday’s data into the multi-day totals, it is necessary to use a complete sequence of data with timestamps. This distinction is important because narratives regarding “sustained net buying” cannot be based on an incomplete table.
Previous reports regarding the week of ETF in September have indicated that there has indeed been a considerable inflow of fund capital recently. However, this does not identify the specific buyers behind Bitcoin's market reactions following the release of the employment report on October 2nd. ETF shares can be traded among investors without creating new fund shares; the issuer's subscription data is recorded according to separate daily cut-off times. Only if there is a new weekly net inflow after the employment report would it be more conclusive that cash buyers are still present.
Other token funds can also be used as a measure of breadth, but if scale is not taken into consideration, the raw dollar inflows cannot be directly compared. Bitcoin ETF attracting $100 million in inflows and a smaller asset fund attracting $10 million in inflows do not have the same impact on their respective underlying markets. Fund fees, product launches, seed capital, and liquidations also affect the data series. New products may attract holders to switch between different carriers, which does not necessarily mean that the entire market has increased its holdings of that token by an equivalent amount.
Cash flow is not a one-way proof. Existing holders can sell when there is a demand for funds; even if new subscriptions reach billions of dollars, Bitcoin could remain sideways. Conversely, even without inflows from the US ETF, if other spot buyers are dominant, the market could still rise. A more useful test is to observe within a clear time frame whether these three independent indicators—fund subscriptions, price, and spot demand—corroborate each other. If they are contradictory, that in itself is a result of the reporting, not a reason to select the most favorable figures.
Spot demand has improved, but it is still below zero.
On October 1st, in its demand research, CryptoQuant stated that its 30-day "apparent demand" indicator improved by 81,000 BTC within a week. According to this method, a reading of -101,000 BTC still indicates a contraction in demand. Analysts noted that the premium for Coinbase remains negative, meaning that the price rebound in the US spot buying has not yet been confirmed.
crypto.news A previous study on the "90-point bull market rating" mentioned that at the end of September, the 30-day spot demand contracted by about 170,000 coins BTC. That article used different dates and snapshots, which does not contradict the subsequent reading of a decrease of 101,000 coins; if the rolling window is improved, the numbers will naturally change. However, neither of these represents direct transaction ledger records for each individual Bitcoin sale or purchase. They are model outputs, and changes in the components of the model can also affect the estimation results.
This distinction is very important for timing judgments. If the apparent demand persists and Bitcoin prices remain at a higher level, then this round of recovery seems more sustainable. If prices break through $90,000, yet the indicator remains negative and the Coinbase premium is also weak, then short covering or buying orders occurring outside that measurement range are still possible explanations. A single negative reading does not rule out a rebound, but it does weaken the claim that "widespread spot accumulation has returned."
The bull market rating itself takes into account a number of factors, including price trends. High scores may coexist with a slowdown in new buying orders. According to its methodology, it can serve as an indicator of market conditions, but it cannot replace a thorough analysis of the individual components of demand. A previous report on rising leverage indicated that this rebound was initially supported by ETF, followed by an expansion in futures positions. If cash demand stagnates while leverage increases, then the resulting rise could be more susceptible to reversal.
Unclosed contracts also require similar restrictions. Their value in US dollars may increase due to the rise in Bitcoin, even if the number of underlying contracts remains unchanged. Each unclosed futures contract has both long and short sides. To determine whether a bull market has begun, one should look at the size of positions denominated in coins, the funding rates, margin calls, and the spot trading volume of various exchanges, rather than considering all newly added nominal values as signs of long-term investors entering the market.
There are three consecutive inspection points in October, rather than a fixed start date.
The U.S. Bureau of Labor Statistics ( BLS ) schedule indicates that the Consumer Price Index for September will be released on October 14th. The Federal Reserve's schedule shows that its meeting is scheduled for October 27th to 28th. The Bureau of Economic Analysis ( BEA ) has scheduled the release of September PCE inflation data for October 29th, which is after the interest rate decisions. The market may react differently to each release.
The employment report for September was released on October 2nd, showing an increase of 29,000 non-farm jobs and an unemployment rate of 4.2%. This led many traders to believe that it is more likely that the Federal Reserve will pause interest rate hikes in October. However, whether a “pause” will actually occur is still to be decided, and the importance of future policy statements may even outweigh the maintenance of the current interest rates. The September CPI data will be released before the policymakers meet; whereas the scheduled release of PCE data is after the meeting. Therefore, when discussing a bullish narrative at the end of October, it would not be appropriate to say that the Federal Reserve “responded” to data that was only made public the following day.
There could be various possible outcomes. If CPI is weak and ETF flows in steadily, Bitcoin prices might rise before the meeting. However, if the Federal Reserve pauses its actions but does so with cautious language, the upward trend could be interrupted. If PCE is moderate the next morning, demand might pick up again; if the data is strong, the trend could reverse. As of October 5th, none of these outcomes can be considered certain, as the data and resolutions have not yet been released.
Yields and oil prices also provide external validation for the argument of “liquidity-driven” trends. If Bitcoin rises while long-term government bond yields and energy costs are also increasing, then this rebound may be more due to the intrinsic demand for these assets rather than simply the logic of “cheap money.” If a wide range of risky assets and crypto assets rise simultaneously after yields decline, then a macroeconomic-driven explanation becomes more credible. Even so, daily correlations cannot identify each individual buyer, but they can narrow down the possible explanations.
The next scheduled release of employment data in the United States for October is on November 6th, so it is not possible for it to be a triggering factor within October. The market may trade ahead of expectations, but there is no released October non-farm payroll data within the testing period of October 31st.
The strongest arguments in favor and the strongest objections
According to reports on Citibank's revised report on October 1st, Citibank has raised its Bitcoin price forecast for the next 12 months from $82,000 to $113,000. The bank mentioned stronger market activity and expected inflows of funds. This view provides a clear supporter and a mechanism for the current bullish logic: under favorable macro conditions, investors gradually build up their positions through more accessible products. However, this forecast covers a period of 12 months, rather than predicting a market breakthrough on a specific day in October.
Opposing evidence is equally important. Despite the clear rise in the third quarter, Bitcoin is still far below its peak in October 2025. The apparent demand indicator for CryptoQuant was still negative on October 1st, and the negative premium for US spot prices also raises doubts about whether local spot buyers have returned. After a strong week of fund inflows, there were again net outflows on certain days. According to a rounded snapshot, the total market value of $2.98 trillion includes approximately $292 billion in stablecoins; therefore, the total market value mentioned in the headline does not represent the value of solely high-risk assets.
The core of the dispute lies in the duration and extent, rather than whether Bitcoin will rebound. Even if there is no consecutive four-week market increase in October, Citibank could still be correct on a 12-month time frame. Even if the cautious assessment of spot demand in October proves to be correct, buyers may return in November. Therefore, this article will not specify a fixed calendar date for a result that current public data cannot yet support.
A more cautious and earliest confirmation period would be a few weeks after the new round of spot demand begins. By then, readers will be able to observe the flow of funds, the market value of unstable coins, and the weekly closing performance at the same time. The first inflation data for October will be released on October 14th, while the combination of the Federal Reserve and PCE will be available on October 28th to 29th. If these dates bring supportive conditions, then by observing for another four consecutive weeks thereafter, the confirmation period will fall into November. If there is a sharp rise in mid-October, the market may start even earlier; however, calling it a widespread bull market at that point would only be a temporary judgment, not a pattern that has been verified over four weeks.
If CPI becomes overheated, yields rise, and the flow of funds reverses, then the confirmation time may be significantly delayed. Based on today's evidence, it is not possible to derive an upper limit. The historical four-year cycles only describe a few past phases, and the ETF products, macro environment, and market structure have all changed. Relying solely on cyclical analogies, it is not statistically reliable to determine the starting date of the next cycle.
A verifiable clock is more useful than a date predictor.
The four-week test proposed in the text consists of three components. First, Bitcoin should maintain a higher weekly trading range, rather than falling back after briefly reaching $90,000. Second, there should be a net cash demand observed in a complete series of fund data, or a sustained positive trend in credible spot demand indicators. Third, the absolute value of the non-Bitcoin, non-stable coin portion of the market should increase during the same period, and this increase should be driven by multiple assets with good liquidity.
These components may not be consistent with each other. Bitcoin could break through $90,000, while the rest of the market remains sideways; in this case, a more accurate description would be "Bitcoin is strengthening." Altcoins might also see a significant increase relative to BTC, but the total market value of the crypto market could decline; this seems more like a relative rotation rather than a bull market across the entire market. An increase in the issuance of stablecoins could also push up the total market value, yet high-risk assets have not risen in tandem. One day, an inflow of ETF could occur, possibly at the same time as a decrease in spot demand elsewhere.
Price levels are merely observation points and not rigid requirements in the definition. On October 5th, Bitcoin was around $85,000, which is about 5.9% lower than the $90,000 level. If it breaks through $90,000, it would indicate a recovery from the recent range; however, it is still far from the previous historical high of over $126,000. If multiple assets and demand indicators are rising in sync, then a new round of market-wide gains does not have to wait until a record high is set to begin. Conversely, a new high for a single asset (such as BTC) could also occur without widespread participation.
This set of rules may also be disproven. If the breakthrough fails, fund redemptions continue, demand indicators become more negative, or the market value of unstable coins declines, then it will not be possible to confirm a bull market using the methods described in this article. Readers can certainly choose different observation periods, but the standards outlined here are announced in advance, before the results are apparent. This is more useful than looking back at charts afterwards and saying, "The bull market started on such and such day."
What can the evidence of October prove, and what cannot it prove?
Inflation data on October 14th could change interest rate expectations. The Federal Reserve's decision on October 28th might alter the cost of funds or change expectations about future trends. The PCE data on October 29th could challenge the interpretations from the previous day. However, none of these events in themselves will compel investors to buy a particular token. It is only market prices, actual fund subscriptions, and breadth indicators that will show whether they indeed do so.
The global market value of CoinGecko is calculated by multiplying the current price by the number of outstanding shares, and it does not represent the total amount of capital invested by investors. Changes in the market value proportion of Bitcoin may stem from either the numerator or the denominator. The apparent demand for CryptoQuant is an estimate based on a model. The fund data row for Farside may also be incomplete before all constituent funds report their figures. These limitations do not mean that the evidence is useless; rather, they indicate what each indicator is intended to answer.
The next bull market may already be in the early stages of Bitcoin leading the gains, or it could be that the rebound in the third quarter is ultimately just a temporary phenomenon. As of the snapshot on October 5th, the estimated spot demand is still negative, and the breadth of participation is still limited. Therefore, according to the four-week definition mentioned in the text, a widespread market bull market has not yet been confirmed. The first scheduled test point will be the CPI for September, which will be released by the U.S. Bureau of Labor Statistics at 8:30 am Eastern Time on October 14th.
Matters of note
- Four consecutive weeks of closing prices: Using the same data tracker and the same dates, record the market values of Bitcoin as well as those of non-Bitcoin and non-stablecoins.
- Complete ETF data: After all funds have completed their reporting, compare consecutive U.S. trading weeks and distinguish between transfers of seed capital and those between different products.
- Apparent spot demand: Observe the 30-day rolling indicator for CryptoQuant to see if it has crossed from negative values on October 1st into a positive range.
- Bitcoin proportion versus stablecoin proportion: Track both of these percentages simultaneously, as well as the absolute value of other high-risk tokens, to identify the true breadth.
- October 14th, 28th, and 29th: Read CPI, the Federal Reserve's decisions, and PCE in chronological order, and consider the market's reaction to interest rates.
Frequently Asked Questions
When will the next round of crypto bull market arrive?
It is not possible to derive a reliable calendar date from the data from October 5th. According to the working definition in this article, to confirm a bull market, it is necessary to observe continuous strength in Bitcoin over four consecutive weeks, an improvement in spot demand, as well as growth in markets that are not related to Bitcoin or stablecoins.
Is the crypto market already in a bull market?
Bitcoin rebounded strongly in the third quarter, and CoinGecko also listed the total value of the global crypto market at nearly $2.98 trillion on October 5th. However, widespread market testing has not yet been confirmed, as as of the most recent observation point, spot demand indicators are still negative, and this article does not show sustained broad expansion.
Does Bitcoin have to reach a record high first?
Not necessary. A sustained and widespread upward trend can begin below previous highs. However, a single new high for Bitcoin alone does not prove that buyers of other assets or spot markets are also participating.
Why is it necessary to exclude stablecoins when measuring a bull market?
The design goal of stablecoins is to maintain a value close to that of a certain currency. The increase in their supply may boost the total market value of cryptocurrencies reported, but this does not necessarily mean that Bitcoin or altcoins have seen a corresponding increase in value.
What does the market value proportion of Bitcoin indicate?
It represents the share of Bitcoin in the total encrypted market value being measured. On October 5th, CoinGecko showed that this proportion was around 56.9%, but this change may stem from fluctuations in Bitcoin, stablecoins, or other assets; therefore, it is also necessary to check the absolute values.
ETF Does the inflow of funds guarantee the arrival of a bull market?
No. Fund subscriptions are just one source of demand; existing holders can also take the opportunity to sell their shares. A continuous and complete sequence of capital inflows is more valuable for reference than a single-day influx. Moreover, the increase in the net asset value of funds as the price of Bitcoin rises does not equate to new capital inflows.
Which event in October could trigger a new round of upward movement?
In September, CPI will be announced on October 14th, while the Federal Reserve will decide on interest rates on October 28th. September PCE will be released on October 29th. Even if there is a rebound after either event, according to the standards outlined in this article, it is still necessary to see continuous improvement in prices, spot demand, and breadth before it can be considered a new round of market trends.
Does predicting a bull market constitute investment advice?
No. The standard described in the text refers to observable market conditions; however, if there is a reversal in price, capital flow, or breadth, these criteria may also become invalid. They do not provide any guarantee of returns, nor do they specify a start date. This is an analytical piece with an educational purpose and does not constitute investment advice.