

Zcash will cool down after September
Bitcoin: $85,000 becomes a critical battleground
Shiba Inu Long-term resistance for bullish testing
$800 remains the main resistance level for BNB.
Zcash ( ZEC ): ZEC is undergoing a correction after a explosive rise in September. The range of $1,280 to $1,330 serves as a key support level, while $1,400 to $1,450 is the first major rebound target.
Bitcoin ( BTC ): While consolidating around $85,000, it still maintains a relatively strong position. If it breaks through $87,000, the target could be between $89,000 and $90,000.
Shiba Inu ( SHIB ): SHIB is currently challenging the long-term resistance range around $0.0000056 to $0.0000057. If it can continue to break through this range, it may open the way for gains towards $0.0000062 and higher levels.
Binance Coin ( BNB ): BNB maintains a relatively strong structure around $800. If it breaks through $805, the upward trend could extend to $820 to $850.
Zcash will cool down after September
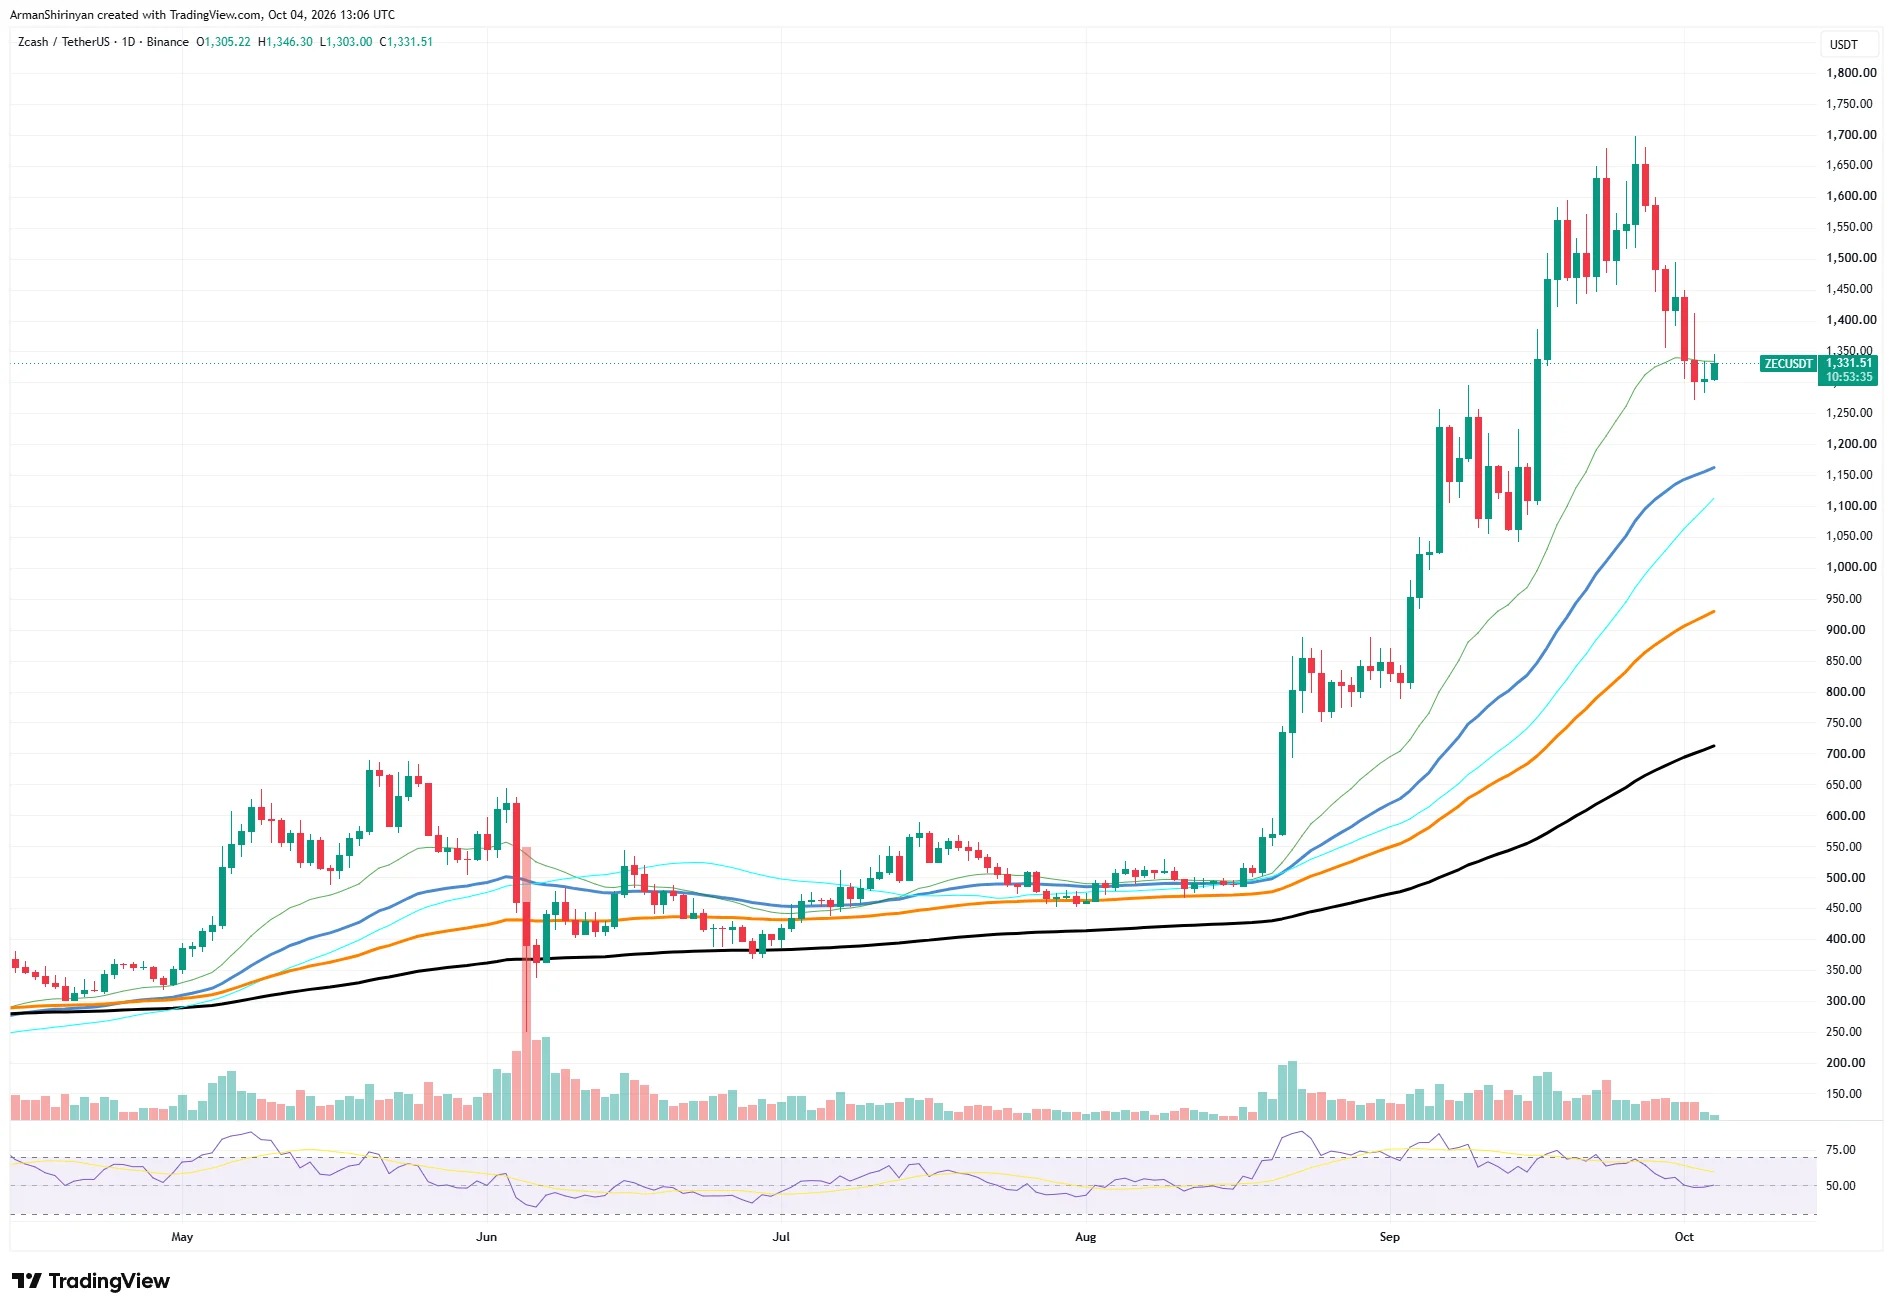
Zcash is experiencing its first significant pullback after a stunning rise in September. According to the provided daily chart, ZEC is currently trading around $1,330, whereas it reached a high of around $1,680 in September. broader market data also confirms the extent of this pullback: ZEC has fallen by about 20% in the past week, while it has risen by more than 180% over the past three months.
From a technical perspective, this decline has directly brought ZEC into an important short-term support area. The range of $1,280 to $1,330 has attracted buying several times, and the short-term moving average has tended to flatten around the current price. However, momentum has clearly deteriorated. After maintaining high levels for most of September, the daily RSI has fallen back to near a neutral zone.
The first major upward target is between $1,400 and $1,450. If it manages to regain this range, it will indicate that the pullback is stabilizing, and there may be a renewed attempt to reach $1,500, with the ultimate goal of reaching the highs of $1,600 to $1,680. On the other hand, if it clearly falls below $1,280, then it is likely to drop to the range of around $1,150 to $1,200, as the next important moving average is approaching that level.
Fundamentally, ZEC also has catalysts recently: The public test network of NU7 is scheduled to go live on October 6th, although the proposed faster block generation time will not be immediately implemented on the mainnet.
For now, ZEC is still in a strong long-term upward trend, but the parabolic upward phase seen in September has clearly come to an end. The question at hand is whether $1,300 will become the bottom of a consolidation period, or just a brief pause in a deeper correction.
Bitcoin: $85,000 becomes a critical battleground
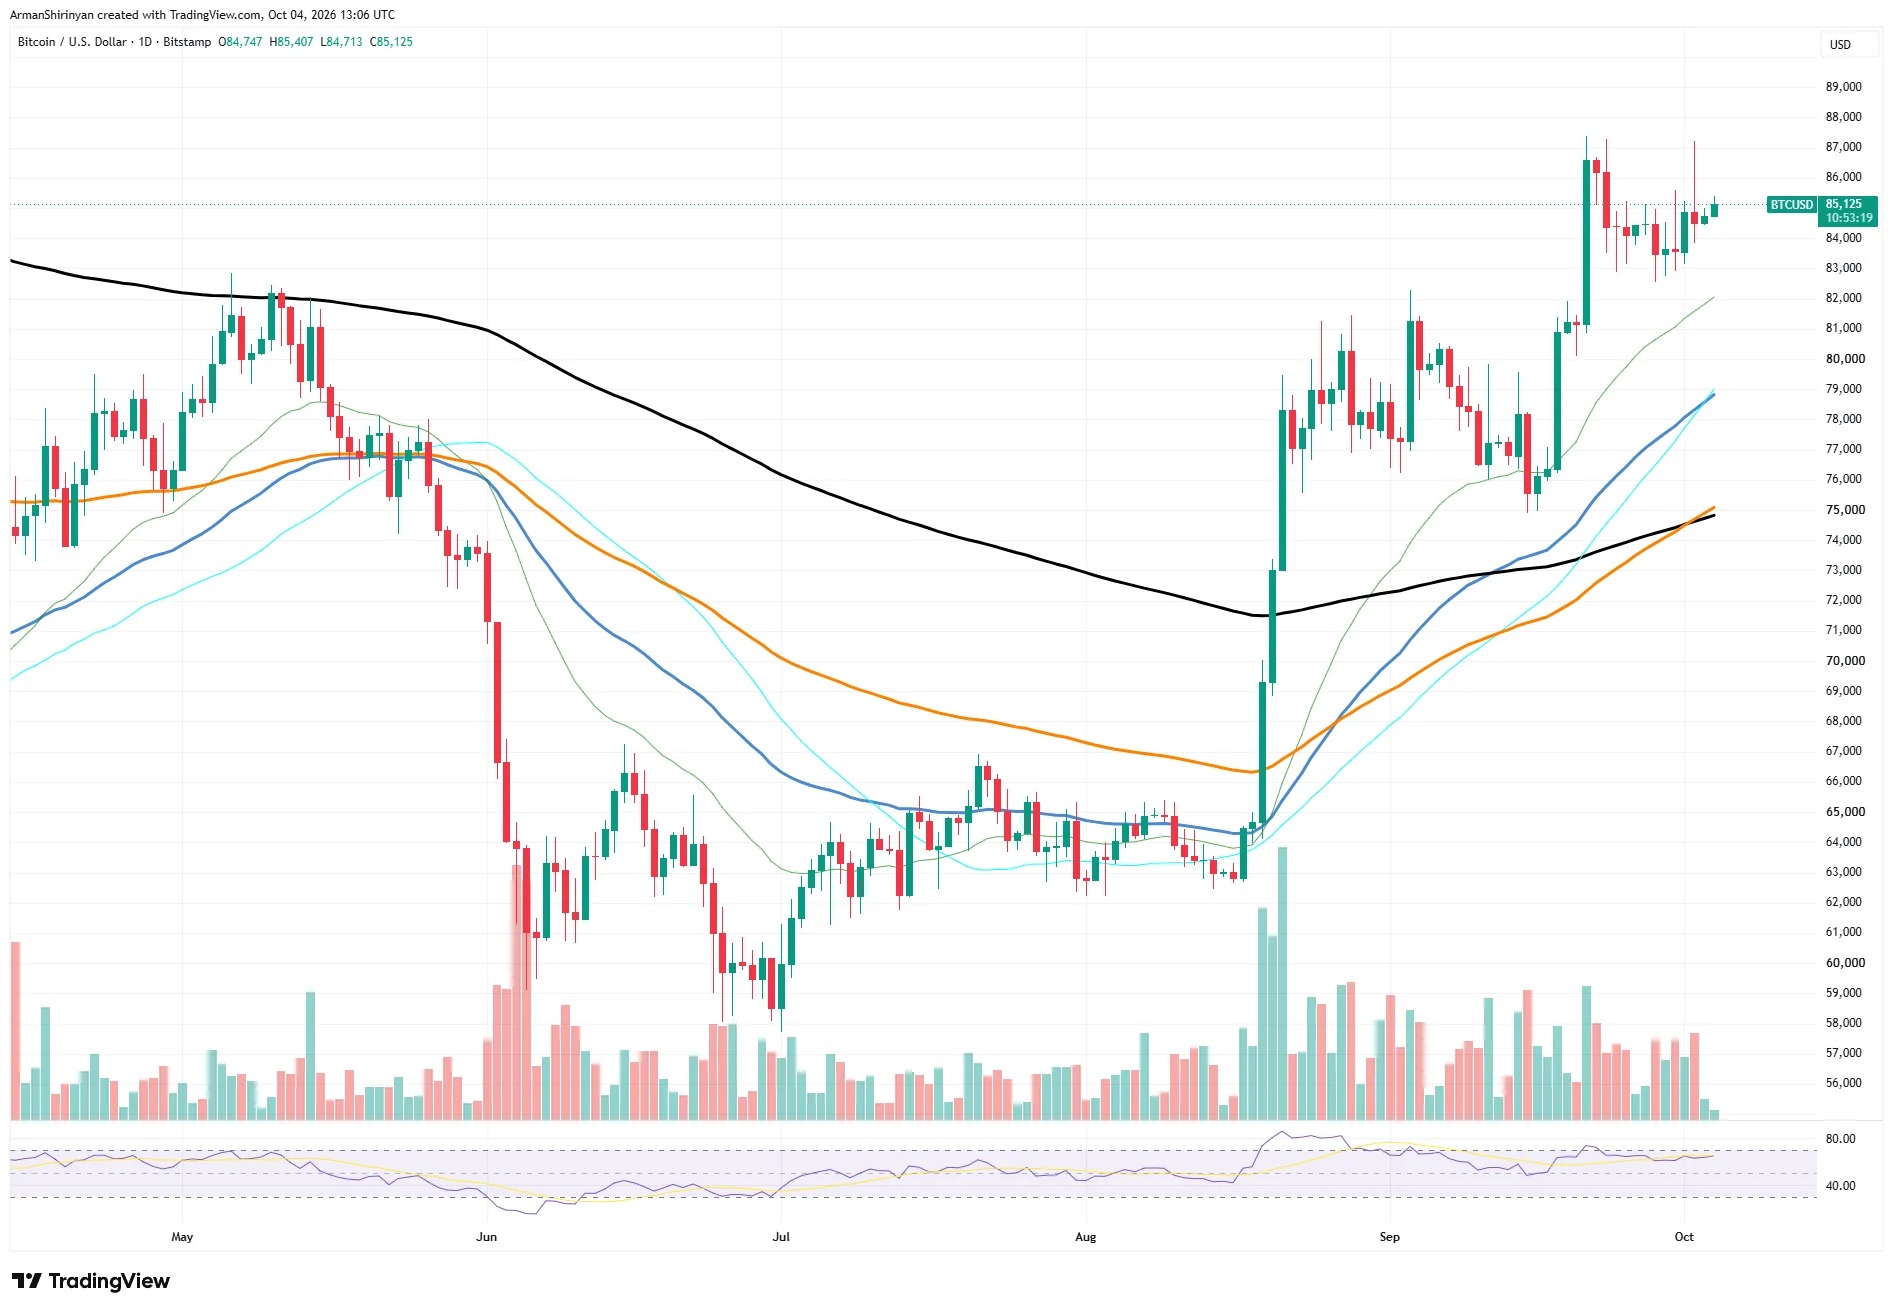
Bitcoin has been consolidating around $85,000 since breaking through at the end of September, and the latest market data shows that BTC is approaching this level. The daily chart provided indicates that the structure of BTC is significantly superior to that of ZEC: BTC remains firmly above all major moving averages, and RSI also stays above the middle line.
The key short-term resistance remains in the range of $86,000 to $87,000. BTC has entered this area several times but has not been able to achieve a sustained breakout, including the most recent attempt to break above $86,000. Therefore, if the daily close exceeds $87,000, it will constitute an important technical confirmation and could bring the range of $89,000 to $90,000 into focus.
Therefore, as long as BTC remains above $82,000, the overall structure is still bullish. Unlike ZEC, Bitcoin is not experiencing a pullback after a sharp vertical rise, but rather consolidating near recent highs. This makes the breakthrough in the current range of $83,000 to $87,000 the clearest signal for the next direction of BTC.
Shiba Inu Long-term resistance for bullish testing
Shiba Inu is attempting to turn the recent rebound into a larger-scale trend reversal, but SHIB has reached one of the most important resistance areas on the daily chart. The token is currently trading around $0.00000570, after having rebounded above $0.00000620 at the end of September.
The most significant change is that SHIB has interacted with its long-term moving average, which has been around $0.0000056 to $0.0000057. This level has acted as resistance for several months, so if it can remain above this position, the technical structure will improve significantly. SHIB has already broken through the shorter-term moving averages, which are now turning upward below the current price.
The first resistance range is between $0.0000059 and $0.0000060. If this range can be broken through, the high point of September at around $0.0000062 will come into view again. Further above that, the range from approximately $0.0000065 to $0.0000067 constitutes the next main target.
The support level is around $0.0000055, followed by a dense area of moving averages between $0.0000052 and $0.0000054. If this area is lost, the strength of any rebound will be significantly weakened, and SHIB could possibly return to around $0.0000050.
Therefore, the structure of SHIB is improving, but it still needs to prove that it can withstand long-term resistance and hold its ground.
$800 remains the main resistance level for BNB.
The daily chart of BNB still shows a clearly strong trend. The price of BNB is above all the major moving averages on the chart, and the shorter-term moving averages continue to rise rapidly. More importantly, since the low point of around $550 in July, the price has formed a series of higher highs and higher lows.
BNB briefly reached $800 in September, but subsequent selling pressure pushed it back down to around $760. Buying interest then held that area and pushed the price back up again. RSI is also around 60, indicating positive momentum, but has not yet entered a state of extreme overboughtness.
The current challenge is the resistance range between $795 and $805. If a convincing daily breakout above $805 can be achieved, it will form a new higher high and may open the way to $820; if the momentum continues to expand, the subsequent target would be around $850.
On the downside, $765 to $770 is the first important support level. Below that, a rising short-term moving average around $755 provides another potential line of defense. An even more crucial support range is located around $720 to $730, where two medium-term moving averages are converging in that area.
As long as BNB remains above $760, the current structure still favors another test of $800. If it breaks through upwards, that will confirm the continuation; if it encounters resistance around $800 repeatedly, then there is a greater likelihood of a larger-scale consolidation.
Success!