

After significant price declines, buy signals appeared on the four-hour time frame for Bitcoin, Ethereum, and XRP. With these three assets still under selling pressure, this presents a potential early rebound opportunity for traders.
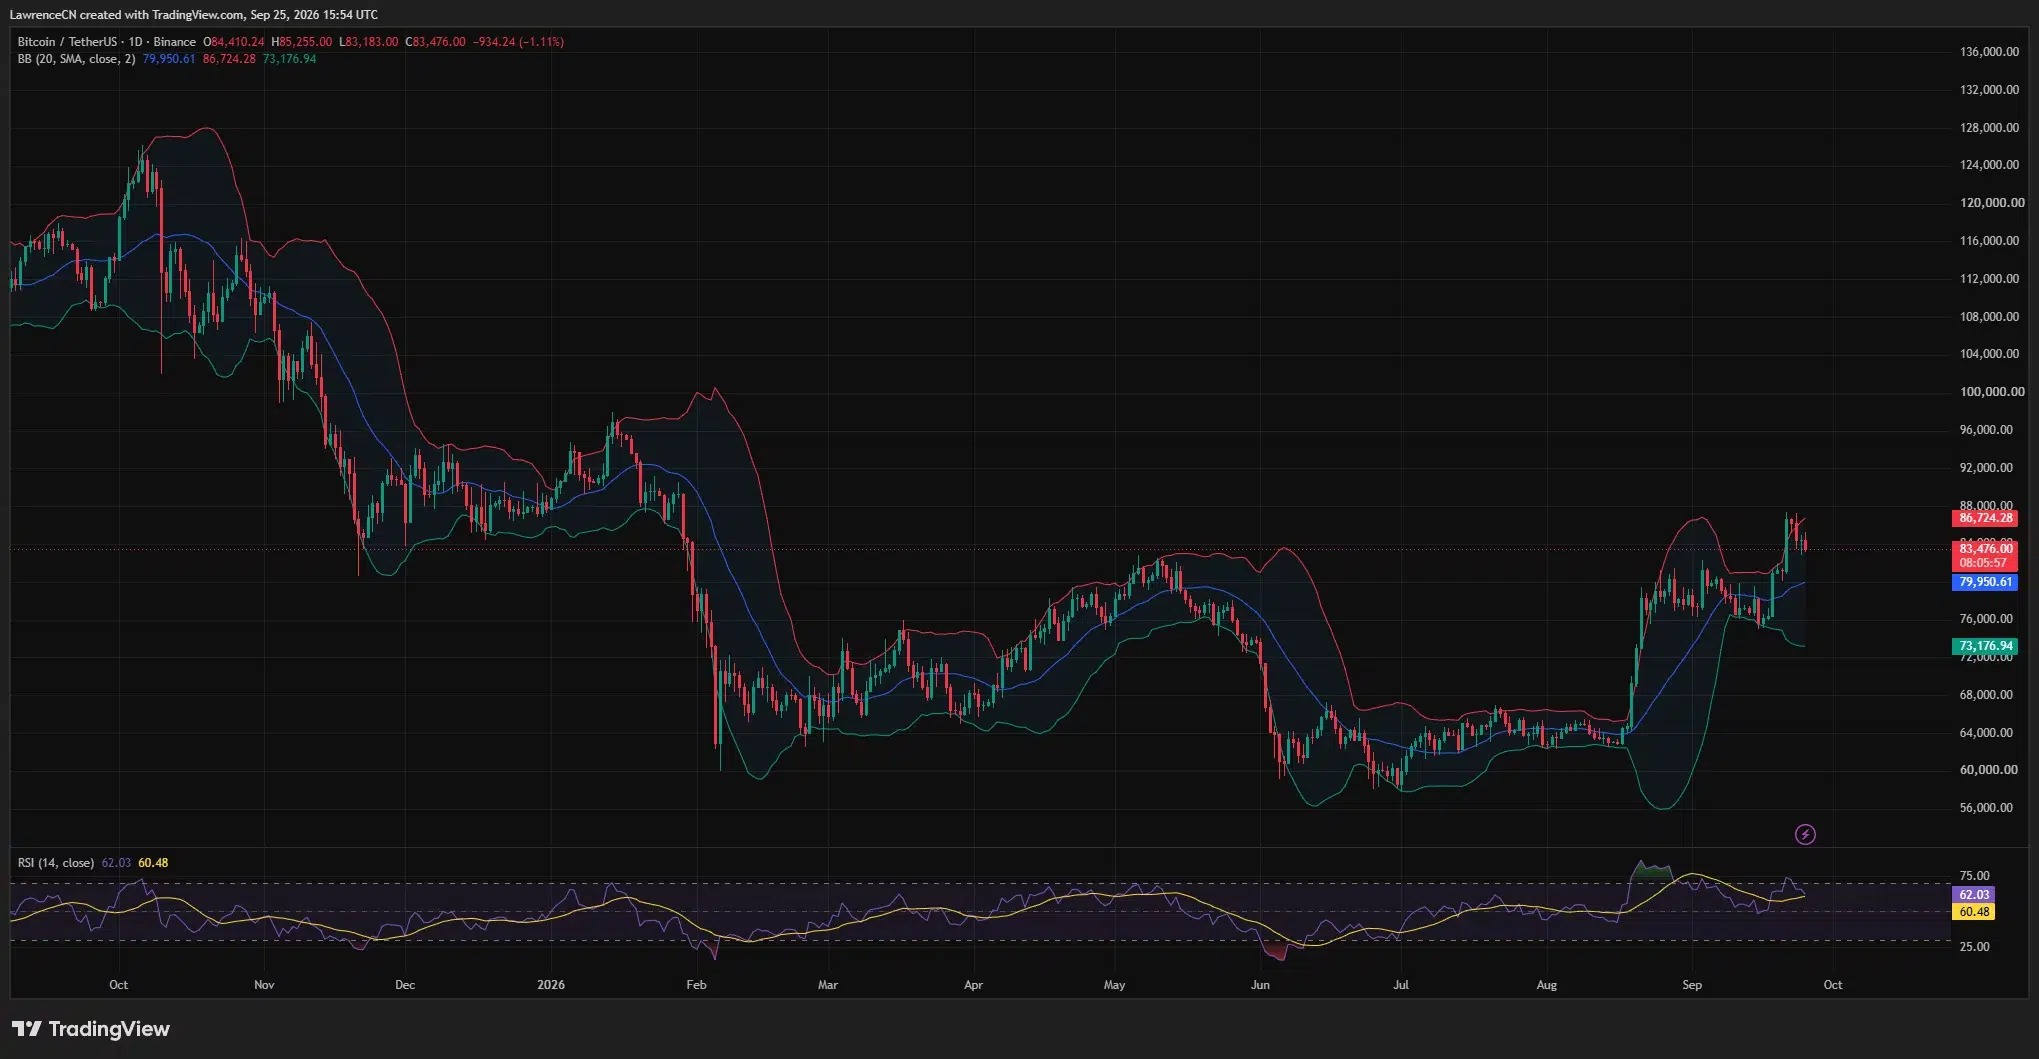
After Bitcoin fell 5.55% from its high on October 5th, a buy signal appeared in the four-hour TD Sequential period.
After a 7.36% decline, Ethereum also showed a four-hour buying signal, with potential repair targets at $2620 and $2650.
According to Ali Charts, after XRP fell from $1.53 to $1.39, the same signal also appeared.
Glassnode believes that the support level for Bitcoin is around $81,000, but the thin trading volume still limits the market's confidence in any rebound.
Fed meeting minutes show that most officials still believe it is appropriate to raise interest rates again before the end of the year.
Ali Charts reported on October 8th that this signal appeared after Bitcoin fell 5.55% from $86,976 on October 5th to a low of nearly $82,150. The analyst stated that this reading indicates that this round of adjustment "may be coming to an end," but also emphasized that the next few four-hour candlesticks still need confirmation from buyers to solidify this pattern.
Bitcoin buying signal appears near a key support area
This signal of Bitcoin appears near an important support area that chain analysts had previously identified. In their market report on October 7th, Glassnode stated that the recent large-scale liquidation clusters were located between around $81,700 and $83,300, while the area with the highest concentration of Binance spot buy orders was around $81,000 to $81,250.
Glassnode believes that the support behind Bitcoin's previous breakthrough above $85,000 was not sufficient. The combined trading volume of spot exchanges and US spot ETF was approximately $6.8 billion per day on a 7-day average, which is lower than on about 90% of the trading days since January 2024. The research institution stated that there was no significant increase in spot activity accompanying the breakthrough above $85,000.
When the previous upward trend reached higher levels, selling pressure began to emerge. Glassnode observed that on October 4th, approximately 86% of the Bitcoin that flowed into exchanges came from short-term holders who were in a profitable position, which represents the highest proportion recorded in the past year. Subsequently, after BTC briefly broke above $85,000, sellers placed another large number of sell orders around the $86,500 to $86,750 range.
Option positions are more constructive. Glassnode indicates that for each unclosed call option, there are approximately 0.56 put options; over a 30-day period, traders spend an average of about $17 million more per day on call options than on put options. However, the institution also reminds that historical records do not provide a clear direction for this configuration.
Another independent on-chain reading also provides a possible supporting factor. Santiment states that on October 5th, 2,4073 bitcoins flowed out of exchanges, which is the largest single-day outflow since March 1st. The balance in exchanges has dropped to about 6.5% of the total Bitcoin supply. Santiment indicates that when demand remains stable, a decrease in the supply from exchanges usually provides support, but the withdrawal of bitcoins from exchanges does not necessarily prove that buyers will immediately push up prices.
Ethereum forms a buying signal after a 7% decline
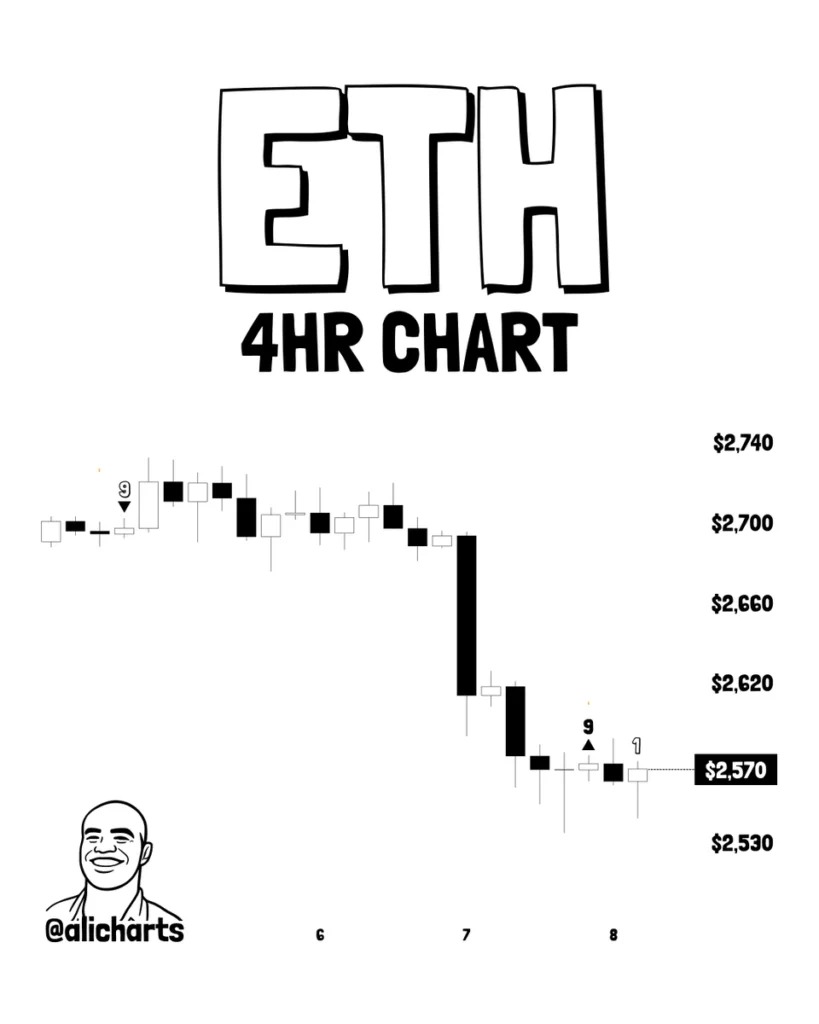
According to Ali Charts, after Ethereum fell 7.36% from $2,738 to around $2,537, a similar four-hour pattern also emerged. In his analysis of ETH, he pointed out that if buyers confirm this signal, $2,620 and $2,650 could become potential recovery targets.
Derivative positions are still crowded. Daan Crypto Trades indicates that the number of open contracts increased significantly after the decline of ETH, and the funding rate turned negative, yet the spot selling pressure remains strong. He describes the current positions as a combination of "bottom-fishing buying" and "going short with the trend."
This analyst stated that after ETH broke below the range it had maintained for two to three weeks, bears still held the upper hand. However, his judgment is conditional, as an increase in open contracts could amplify fluctuations in either direction later on when high-leverage positions begin to be closed out.
The repair target given by Ali is slightly higher than the current market level. It needs to rise from around $2,558 to $2,620, which represents a gain of about 2.4%; if it rises to $2,650, it would be about 3.6% higher than the latest price of CoinGecko. However, neither of these two target levels has been confirmed yet.
XRP Buy signal appears near the $1.40 support level.
After falling from around $1.53 to $1.39, a third TD Sequential buy signal appeared. Ali Charts indicates that an earlier TD Sequential sell reading occurred near the recent local high of XRP, while the new signal increases the likelihood of forming a local low.
Current price data indicates that XRP remains close to this potential bottom area. CoinGecko data shows that XRP is trading at $1.41, with a 24-hour decline of about 4.6%, and the intraday fluctuation range is between $1.40 and $1.46. The trading volume is approximately $2.5 billion, and there are about $4.64 billion in open positions for perpetual futures contracts.
Other technical analysts remain cautious. EGRAG Crypto believes that $1.41 and $1.37 are possible retest levels; if selling pressure persists, deeper downside areas could be between $1.32 and $1.27. His judgment is that only when buyers regain control of the $1.55 to $1.60 range will the short-term bearish view change.
As reported by crypto.news in their support analysis of XRP, on October 6th, despite a net inflow of 3.14 million US dollars into US spot XRP ETF, XRP continued to decline. Therefore, the $1.40 range had already attracted attention prior to that time.
What will confirm the rebound of Bitcoin, Ethereum, and XRP?
The TD Sequential reading is used to identify a possible exhaustion state that may occur after a series of price changes. However, it cannot confirm the bottom on its own. The Ali Charts indicates that the next few four-hour candlesticks need to show a return of buyers for these signals to be confirmed.
According to the data from Glassnode, Bitcoin has the clearest near-term market pricing. Support is concentrated between around $81,700 and $83,300, while large buy orders on Binance are located near $81,000. On the upside, Glassnode states that if the price can stabilize above $85,500 again, it will regain the levels lost earlier this week. Another potential short-clearing zone is between $87,100 and $95,900, with the largest area near $92,000.
For ETH, if the four-hour pattern is confirmed, Ali focuses on $2620 and $2650. XRP will still be close to the $1.40 range; however, if buyers cannot hold this level, EGRAG's analysis still targets $1.37 as well as the range between $1.32 and $1.27.
The macro environment remains another variable. The minutes of the Federal Reserve's meeting on September 15-16 show that most participants believed it might be appropriate to raise interest rates again before the end of the year, but officials also stated that future decisions would depend on subsequent data. At that meeting, the Federal Reserve raised its target interest rate range by 25 basis points to 3.75% to 4%.
On October 7th, in a report about market selling, crypto.news stated that as leveraged long positions were forced to exit, BTC, ETH, XRP, and SOL all saw significant declines; data from CoinGlass indicated that the amount of liquidations reached hundreds of millions of dollars.
The next important inflation data to be released in the United States is the CPI for September, which will be published on October 14th, while the Federal Reserve's next policy meeting is scheduled for October 27th to 28th.
Disclosure: This article does not constitute investment advice. The content and materials contained on this page are for educational purposes only.