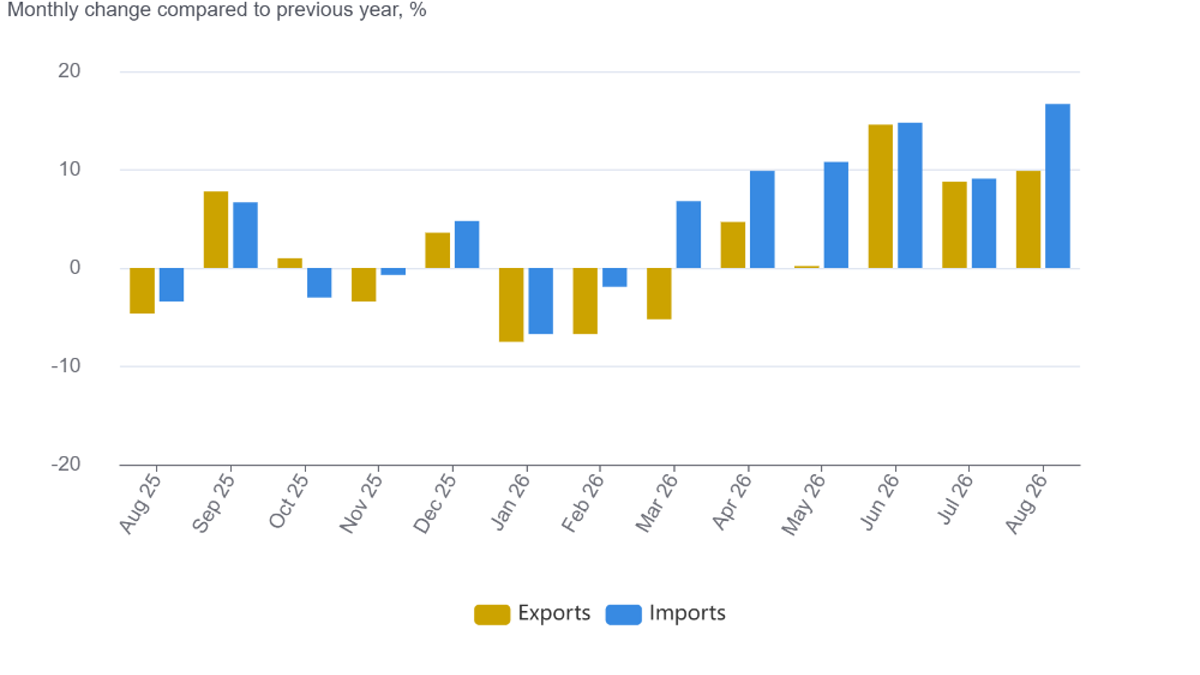
The U.S. Bureau of Labor Statistics released the September import and export price indices on October 16, providing another perspective on inflation for the macro market: import prices rose 1.1% month-on-month, up from 0.5% after revision in the previous month; export prices rose 2.2% month-on-month, compared to 1.2% in the previous month. Import prices increased by 8.1% year-on-year, while export prices rose by 11.6% year-on-year. These figures are notable, but they are not the Consumer Price Index, nor can they be directly applied to calculate the increase in the cost of a basket of goods purchased by residents. Price indices measure changes in the prices of goods and services in cross-border transactions, and it takes time for these changes to be reflected in corporate costs, retail prices, and profit margins through contracts, inventory levels, exchange rates, and competition.
Rises on the import side occurred in both fuel and non-fuel items. In September, fuel import prices increased by 4.8% month-on-month, with oil and petroleum products rising by 4.6% and natural gas by 1.6%. Non-fuel import prices rose by 0.7%, and the Bureau of Labor Statistics noted that there has been no monthly decline since August 2025. Among non-fuel items, capital goods, industrial materials, automotive-related categories, and some consumer goods drove the increase this month. This indicates that attributing all of the increase in import prices to energy would overlook a broader cost backdrop; however, based on just one month's data, it is also not possible to assert that all companies have passed on these costs to consumers.
On the import side: In addition to the energy shock, there are also issues with equipment and raw materials.
Monthly price changes need to be considered in conjunction with the base level and volatility. Fuel prices fell slightly last month and more significantly in July; after a rebound this month, they will significantly boost the overall index. On a year-on-year basis, fuel import prices have risen by 34.5%, with natural gas prices increasing by 96.5% year-on-year. Although the latter figure is substantial, it does not mean that overall energy prices in the United States have nearly doubled; it only corresponds to a specific statistical measure of "imported natural gas prices." The actual energy bills paid by businesses are also affected by sources of procurement, transportation, hedging, and inventory levels. If reports present these individual increases as overall social energy inflation, they are misrepresenting the scope of the statistics.
Non-fuel import prices increased by 0.7% month-on-month and 6.0% year-on-year, indicating that the pressure is not limited to a few highly volatile commodities. The Bureau of Labor Statistics listed several contributing factors, including non-fuel materials for industry, capital goods, automobiles and parts, and consumer goods. Among them, the price of imported capital goods rose by 0.9% in September, with prices of computers, peripheral equipment, and semiconductors playing a driving role. For companies that purchase equipment, the increase in import unit prices may affect their investment budgets; for downstream producers, rising raw material costs may squeeze their gross margins. However, whether companies will raise prices depends on the strength of demand and the competitive landscape. Even though both are considered "imports," the pricing mechanisms for precision equipment and food are completely different, and the overall index cannot be regarded as a uniform impact.
The foreign trade price index also differs from the trade volume announced by the customs. Trade volume is determined by both price and quantity; an increase in import amounts could be due to buying more, higher unit prices, or both factors occurring simultaneously. The price index attempts to isolate changes in quantity. Therefore, a 1.1% increase in import prices does not necessarily imply that U.S. import volumes will also increase by 1.1%, let alone that the trade deficit will widen by the same amount. When analyzing business operations, it is best to consider import prices together with import volumes, retail sales, and inventories of production materials, rather than drawing directional conclusions based on a single total figure.
On the export side: Price increases may either improve revenue or weaken competitiveness.
Export prices increased by 2.2% month-on-month in September, with agricultural exports rising by 2.6% and non-agricultural exports by 2.1%. The increase in agricultural exports is related to the prices of soybeans, corn, and wheat; non-agricultural exports also include industrial materials, capital goods, automobiles, and consumer goods. A year-on-year increase of 11.6% in export prices may seem beneficial to exporters' nominal income, but if the price increases lead to a reduction in overseas orders, the decline in volume could offset these gains. Different companies have varying production costs and settlement currencies, so it cannot be assumed that an increase in export prices necessarily means improved profits.
The so-called terms of trade are used to observe how many imported goods a country can obtain in exchange for its exported goods, by measuring the change in export prices relative to import prices. They are not the same as the trade surplus or deficit, nor do they reflect all services trade and financial flows. In September, the increase in export prices exceeded that of import prices, which at least suggests that researchers should examine these relative price changes. However, a single-month comparison cannot replace the formal terms of trade index and its country-specific components. The Bureau of Labor Statistics also provides price indicators by region and country of origin. When interpreting these data, it is essential to clarify whether the prices refer to imports from a particular source or to all imported goods, and one should not make arbitrary extrapolations across different categories.
For policies and markets, a more reasonable use of this report is to assess whether the price chain continues to be under pressure. The next step is to observe whether non-fuel import prices, producer prices for enterprises, consumer prices, and actual transaction volumes change in the same direction over several consecutive months. Import prices sometimes change before end-user prices, while at other times they may be absorbed by profit margins or supply contracts; increases in export prices sometimes reflect international demand, and at other times they indicate supply constraints. A single release provides a cross-section of prices, rather than a definitive forecast for future inflation, interest rates, or exchange rates. If markets make investment decisions based on this information, they should also consider data revisions, statistical methods, and other indicators from the same period.
Enterprise procurement contracts may lock in prices months in advance, and maritime transportation and warehousing further delay the time it takes for goods to reach their final destinations. As a result, price increases across borders this month may not be fully reflected in consumers' bills next month; if demand weakens, companies might choose to sacrifice profits rather than raise prices. To accurately observe the actual impact, it is best to track continuous changes rather than relying on a single high value from one month to make trend judgments.
Source: U.S. Bureau of Labor Statistics, October 16, 2026 " U.S . Import and Export Price Indexes — September 2026": https :// www.bls.gov / news.release / ximpim.nr0.htm