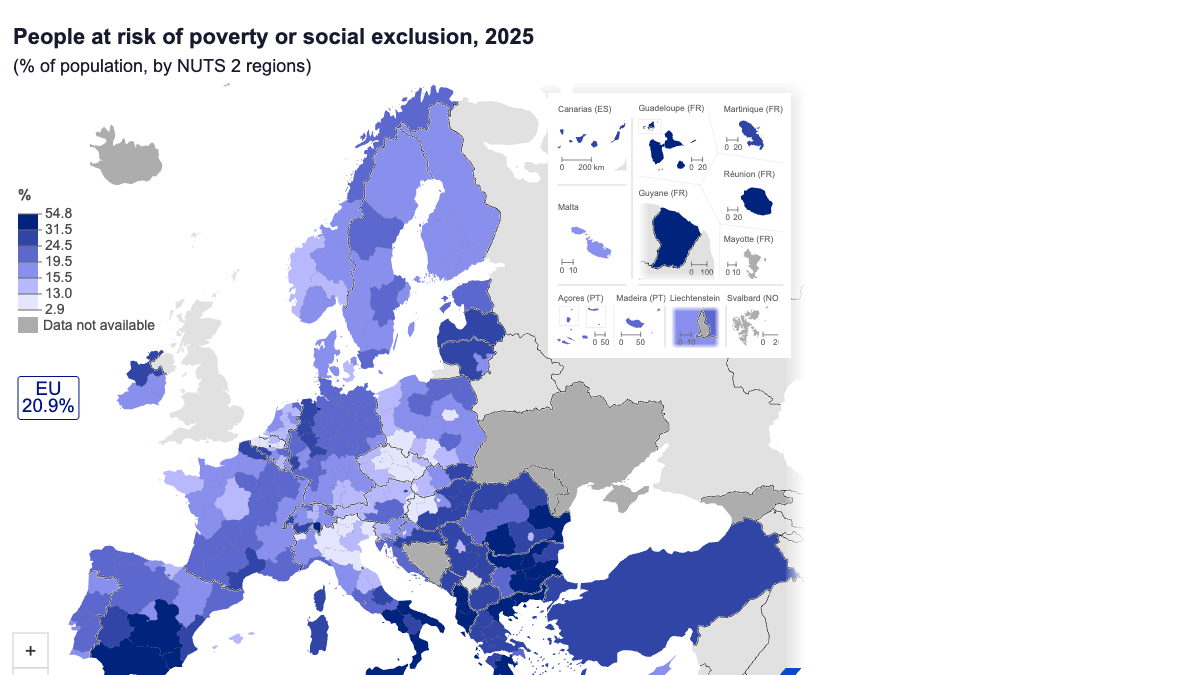
Regional data released by the European Statistical Office on October 16 brought to light an issue that is often obscured by macroeconomic growth rates: By 2025, approximately 92.7 million people in the EU will be at risk of "poverty or social exclusion," accounting for 20.9% of the total population. This indicator does not refer to the number of people who are already in absolute poverty, nor to the unemployment rate. It comprehensively reflects risks such as relative income poverty, severe material and social deprivation, or living in families with very low labor participation rates. Even if the EU's overall economy continues to grow, housing costs, income distribution, and job opportunities in certain regions may still prevent many people from benefiting from this growth.
Regional disparities are more pronounced than the EU average. Among the 243 secondary statistical regions for which data is available, 24 regions have a risk ratio of at least 31.5%; another 24 regions have a ratio below 13.0%. The highest is French Guiana, with a ratio of 54.8%. Calabria and Sicily in southern Italy have ratios of 45.3% and 44.0%, respectively; Melilla in Spain and French Réunion also have relatively high levels. If only the “EU average of 20.9%” is presented, it would be difficult for readers to realize that residents in different regions face vastly different income and public service conditions.
Why is there such a large disparity within the same economic entity?
Risk indicators are sensitive to employment opportunities, but they are not solely determined by employment. Even if someone in a family has a job, they may still lack sufficient disposable resources due to low wages, frequent temporary contracts, and heavy family support burdens. Conversely, in areas where economic activity is not particularly vigorous, social security and public services can help mitigate material shortages. Living costs, housing availability, transportation, education, and medical resources all affect the actual standard of living that nominal income can purchase. Therefore, it is not possible to directly infer from a regional map which places have harder-working residents or which government policies are bound to fail. It is necessary to analyze employment, income, prices, and family structure together.
The European Union Statistical Office uses NUTS secondary regions for comparison, which is conducive to cross-country observations. However, the population sizes and geographical characteristics of regions at the same level are not entirely the same. There are significant differences in economic structures between the peripheral areas and the capital region, as well as between the islands and the continental industrial zones. The high proportion in French Guiana cannot be taken as a representative of all regions in mainland France, and the risks in the Brussels capital region do not represent the average for the whole of Belgium. A common mistake in news writing is to treat local extreme values as representing the entire country, or to use national rankings to explain internal regional disparities. Maps should be the starting point for raising questions, not the endpoint for causal conclusions.
The distribution in low-risk areas also deserves attention. According to the European Union Statistics Office, the 24 regions with a risk level below 13% include several capital areas in Central and Eastern Europe, some regions in northern Italy, as well as northern Belgium and Austria. This does not mean that these places are free from life pressures; a risk level below 13% still indicates that a considerable portion of the residents are facing risks. Statistical indicators can guide the allocation of policy resources, but they cannot reveal the specific difficulties faced by each family. High housing prices in cities and the lack of employment services in rural areas can lead to different living experiences despite the same risk rate.
How should economic policies make use of this set of numbers?
Regional data is of direct significance for fiscal transfers, vocational training, transportation connectivity, and the layout of social services. If a region consistently faces high risks, providing one-time subsidies may alleviate immediate difficulties, but it is difficult to address structural issues such as a lack of stable jobs, mismatches between skills and job positions, and insufficient resources for children's education. Conversely, improving macroeconomic growth should not be used as a reason to cut down on grassroots services, as the averages at the national or EU level may mask the reality that some regions are continuously falling behind. Budget planners need to take into account both the number of people at risk, the risk rate, and the coverage of public services, avoiding a simplistic equation between low-population areas and high-population areas.
This data corresponds to the year 2025, not the real-time situation of October 2026. The European Union Statistics Office reminds in its report that the article is based on the 2026 edition of the regional yearbook, and the relevant data may be updated in the future. It also mentions that October 17th is International Day for the Eradication of Poverty, so there is a public policy context at the time of release. When reporting, it is important to adhere to the time frame of 'data from 2025, announced in 2026'; one should not describe observations from the previous year as having suddenly worsened on that day, nor should it be claimed that 92.7 million people in the EU are currently living in the same level of poverty.
For observers of the investment market or policy, such social indicators do not directly trigger interest rate trading like GDP and inflation, but they do affect consumer resilience, regional fiscal pressures, and long-term productivity. In regions where residents lack certainty about the future, households tend to consume and invest in education more cautiously, and it is also more difficult for businesses to establish a stable supply of talent. However, this transmission mechanism is long-term and complex, and no single map can provide accurate growth forecasts. The most solid conclusion from the data is that the spatial distribution of social risks in Europe is very uneven, and any unified policy must account for differences in regional implementation.
When making comparisons, it is also important to keep two things in mind. The risk rate and the number of people affected by that risk are not the same thing: even if the proportion in sparsely populated areas is high, the absolute number of people affected may not be higher than that in metropolitan areas; these two factors determine different priorities for budget allocation. The statistical criteria refer to "meeting at least one risk condition," not all three difficulties occurring simultaneously. If public discussions describe everyone as unemployed or homeless, policy measures may deviate from actual needs. A more mature approach is to cross-check regional data with factors such as age, family type, and housing burdens to identify the groups that truly need support, and then assess in the next round of updates whether the policies have improved the situation.
Source: Eurostat, October 16, 2026 Regional divide in risk of poverty or social exclusion: https :// ec.europa.eu / eurostat / web / products-eurostat-news /w/ edn-20261016-1