

The Sandbox Prices have rebounded driven by increased trading activity, indicating that market participation has warmed up again; sustained buying pressure is of vital importance.
If the broader crypto market environment improves, and the The Sandbox ecosystem attracts more interest from strong investors, SAND could potentially reach $0.10 in 2026.
In the past few weeks, the price of The Sandbox has received widespread attention, once rising by over 170%, followed by a certain correction. After months of downward pressure, this crypto asset has begun to show signs of recovery and has returned to the market's focus. On the other hand, derivative activities have also increased, but the low cumulative trading volume (CVD) has raised concerns, as it indicates that buying pressure is still uncertain.
Currently, the price of SAND is trading around $0.062, with market attention focused on the local resistance area near $0.07; if it can break through this level, this metaverse token could emerge from the bear market. The question is, will this rebound continue upward, or will it be interrupted by a new wave of selling pressure?
SAND Price faces resistance at $0.069
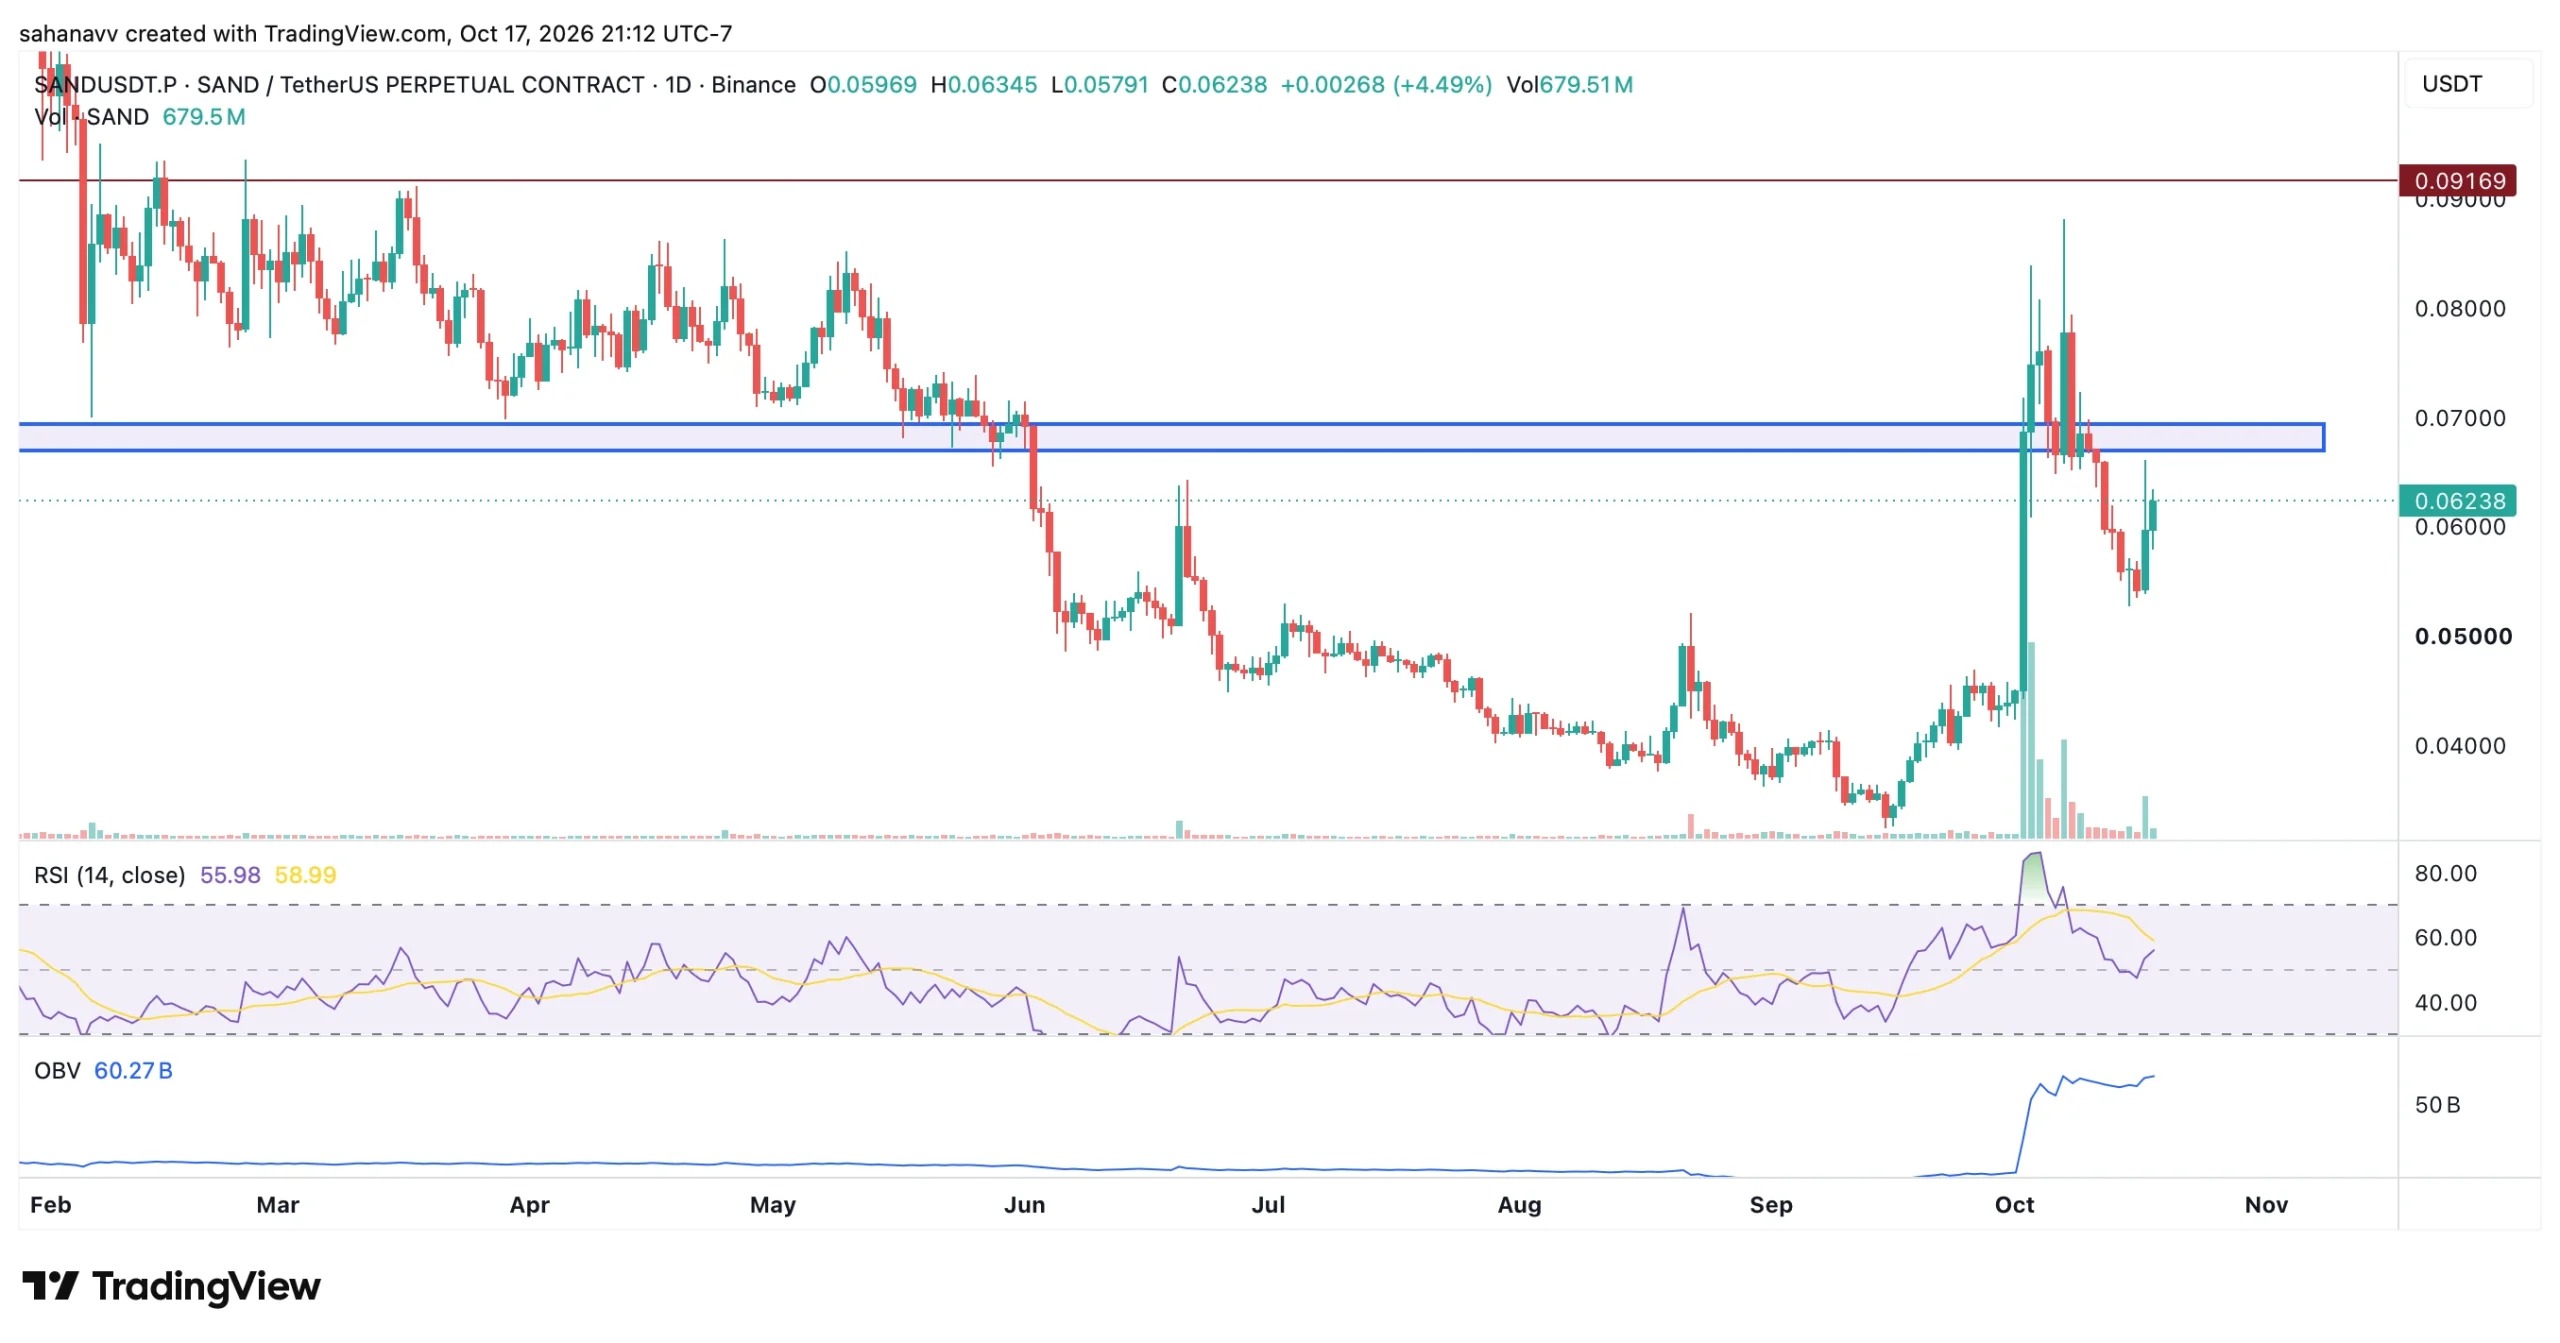
SAND The price has rebounded from its September low of around $0.035, then quickly rose to $0.08 in October, only to fall back again. Currently, the price is around $0.063, with the resistance level at $0.069. The latest rebound seems to have attracted bulls into the market, and trading volume has also increased, with 24-hour trading volume rising by nearly 560% to reach $225 million. Therefore, if the price continues to rise and breaks through the current $0.07 resistance level, it could create room to move towards $0.08 and higher levels.
RSI has rebounded from a neutral level, indicating that bullish momentum has somewhat recovered, but this has not yet been confirmed. Meanwhile, the Energy Tide indicator (OBV) has soared significantly, reflecting increased trading activity, but this does not confirm the continued presence of buying interest in the spot market. For now, the price trend of SAND seems more like a potential recovery rather than a confirmed trend reversal. If it can once again exceed $0.069, that would strengthen the bullish case; if it fails to hold above that support level, then the rebound in October may be at risk.
Increasing positions and negative funding rates indicate volatility
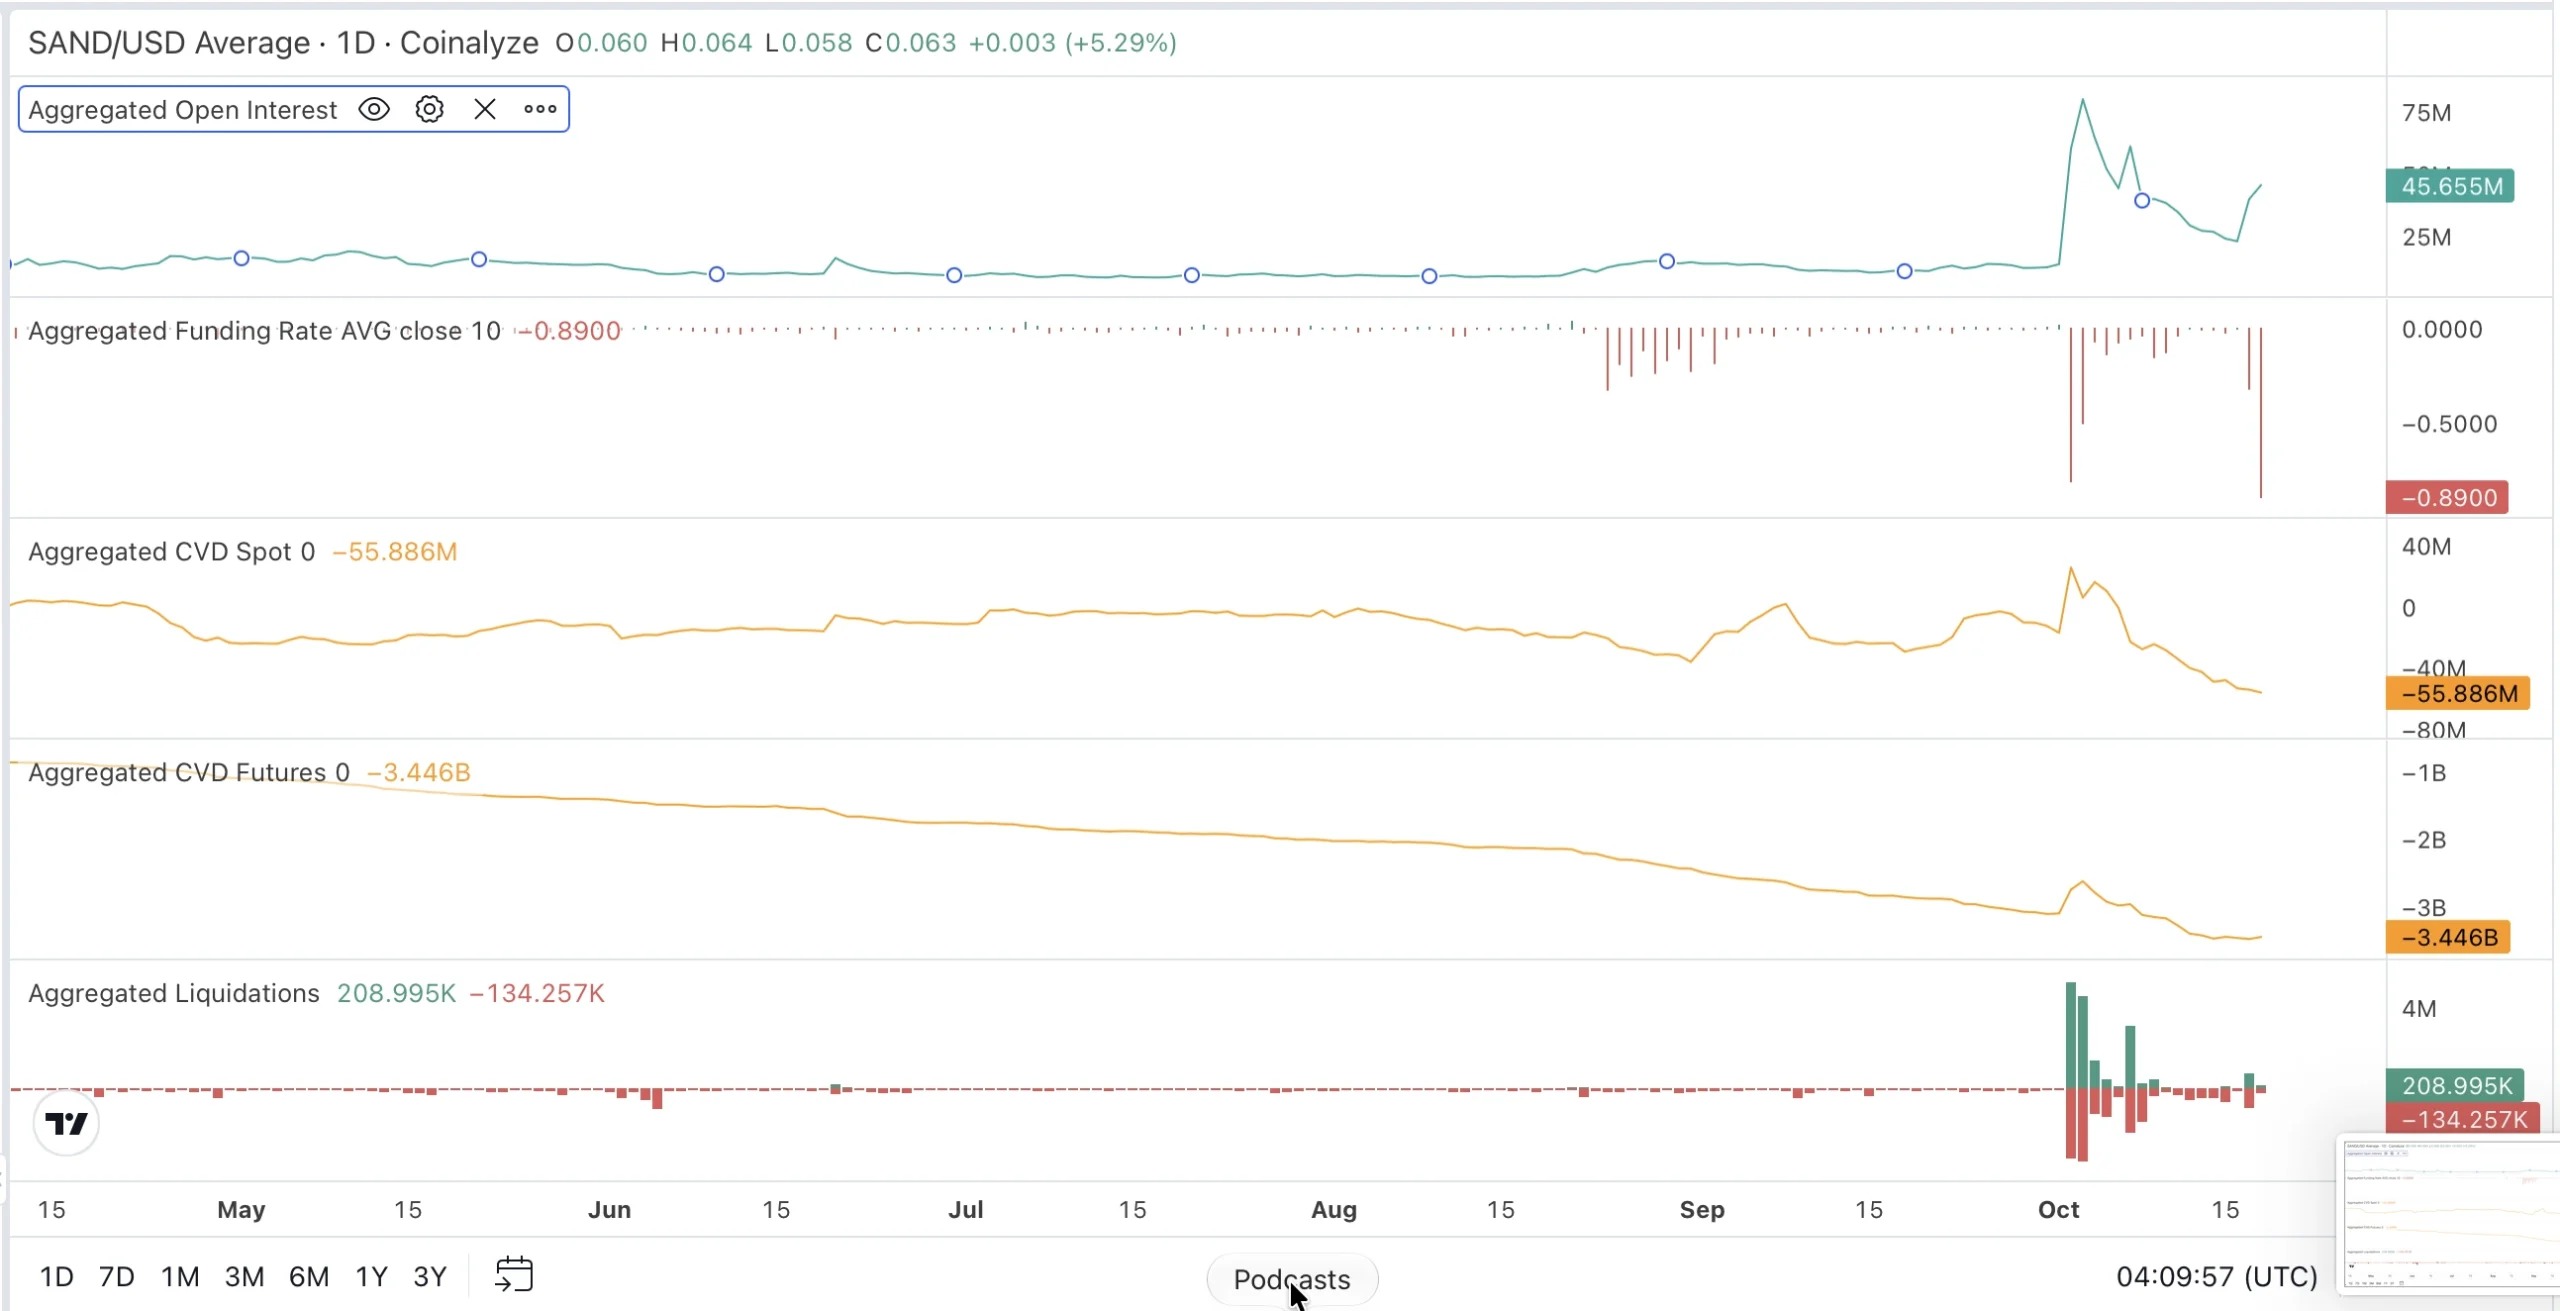
Derivative data for SAND indicates that market participation increased significantly after the rebound in October; however, the underlying buying pressure remains uncertain. The rise in open interest and negative funding rates suggest the potential for short squeeze, while the decline in CVD indicates that selling pressure continues.
- Position size: OI has significantly rebounded from a local low of around 23.4 million to 45.65 million, indicating an increase in derivatives activity.
- Funding Rate: The funding rate has significantly turned negative to -0.8900, indicating that shorts are paying fees to longs, reflecting a bearish market bias.
- Spot CVD: After a brief surge during the October volatility, the spot CVD has dropped to -55.66 million, indicating that aggressive selling pressure has outweighed aggressive buying pressure. This also raises a question: Can spot demand support this round of recovery?
- Futures: CVD : Futures: CVD also fell to -3.44 billion, indicating a continuous net aggressive selling in the derivatives market, which weakens the bullish logic.
- Liquidation: The chart shows continuous liquidation activities during the period of soaring prices in October and the subsequent decline.
The combination of negative funding rates and high positions implies that a further round of short squeeze is still possible. However, the decline in spot and futures CVD indicates that buying pressure has not yet been confirmed. If spot CVD continues to rebound and prices break through the resistance range of $0.067 to $0.069, the bullish outlook will strengthen; otherwise, this rebound may once again face selling pressure.
Key price levels to watch
The next trend may depend on whether buyers can hold onto the immediate support and regain the resistance zone. As the token trades around $0.062, the following prices may determine whether the recovery in October will continue or reverse.
- Immediate resistance: $0.064 to $0.065
- Main resistance: $0.067 to $0.069
- Higher resistance: $0.077 to $0.080
- Key support: $0.060 to $0.061
- Support range below: $0.057 to $0.058
Bullish scenarioIf the price of SAND manages to rebound to the range of $0.067 to $0.069 with stronger trading volume and improved support from the spot market of CVD, the rally could extend to $0.077 to $0.080, or even up to $0.09169. To continue moving towards $0.10, further upward momentum is needed.
Bearish scenarioIf the price of SAND fails to break through the resistance level and falls below $0.060, selling pressure could push the token down to the range of $0.057 to $0.058. If it continues to weaken, the range of $0.053 to $0.055 could also become visible.
Conclusion: The Sandbox ( SAND ) Can the price reach $0.1 in 2026?
The upside potential of SAND in 2026 will depend on the broader market sentiment, the demand for metaverse tokens, and whether the activity within the The Sandbox ecosystem improves. It is still possible for the price to rise to $0.10, but this would likely require a sustained recovery in the crypto market and renewed interest from investors in the project.
The key catalytic factor that needs attention is whether the price of The Sandbox can attract sufficient new demand to support its recovery, rather than relying solely on short-term speculative activities. Without greater participation, it may be difficult for the token to maintain its recent gains.
Overall, there is still room for further price increases for SAND in 2026, but $0.10 should be considered an upper range rather than an inevitable target. Sustained demand and improved market conditions will be key to this token approaching that level.