

Brief
- Monero ( XMR ) continues to rise after breaking through the September high
- Stellar ( XLM ) fell below $0.18, with sellers continuing to dominate the trend
- Bitcoin ( BTC ) encounters resistance around $84,000
- Hyperliquid ( HYPE ) Testing key support levels
Brief
- Monero ( XMR ): After breaking through the September high of nearly $635, the price has been hovering around $629, and RSI is approaching 70.
- Stellar ( XLM ): The price is hovering around $0.1777, below all major moving averages, with support at $0.172.
- Bitcoin ( BTC ): After encountering resistance around $84,000, the price has been hovering around $81,500, with $80,000 serving as a key support level.
- Hyperliquid ( HYPE ): The price is hovering around $78.17 and is testing the key support level of around $77.60 after a 20% decline.
Monero ( XMR ) continues to rise after breaking through the September high
Monero is one of the charts with the strongest trends in the current market. XMR is currently hovering around $629, with intraday fluctuations ranging from $604 to $656. This currency has more than doubled in value since its low point in July, which was around $300, and the trend remains upward.
The most important news is that the price has broken through the 635 USD level near the high of September. This level had been suppressing prices in mid-September, but now XMR has reached this level. If the daily close continues to remain above this area, it will confirm this breakthrough.
The price during trading once tested 656 US dollars before falling back. The upper shadow indicates that there is still selling activity in this area. This is a minor warning, but it is not enough to suggest that the trend has been broken.
All major moving averages are sloping upwards and are located below the price. The short-term averages are around $565 and $548, the medium-term averages are around $538, and the long-term averages are around $492 and $443, respectively. The significant distance between the price and the long-term averages indicates that this upward trend is quite rapid.
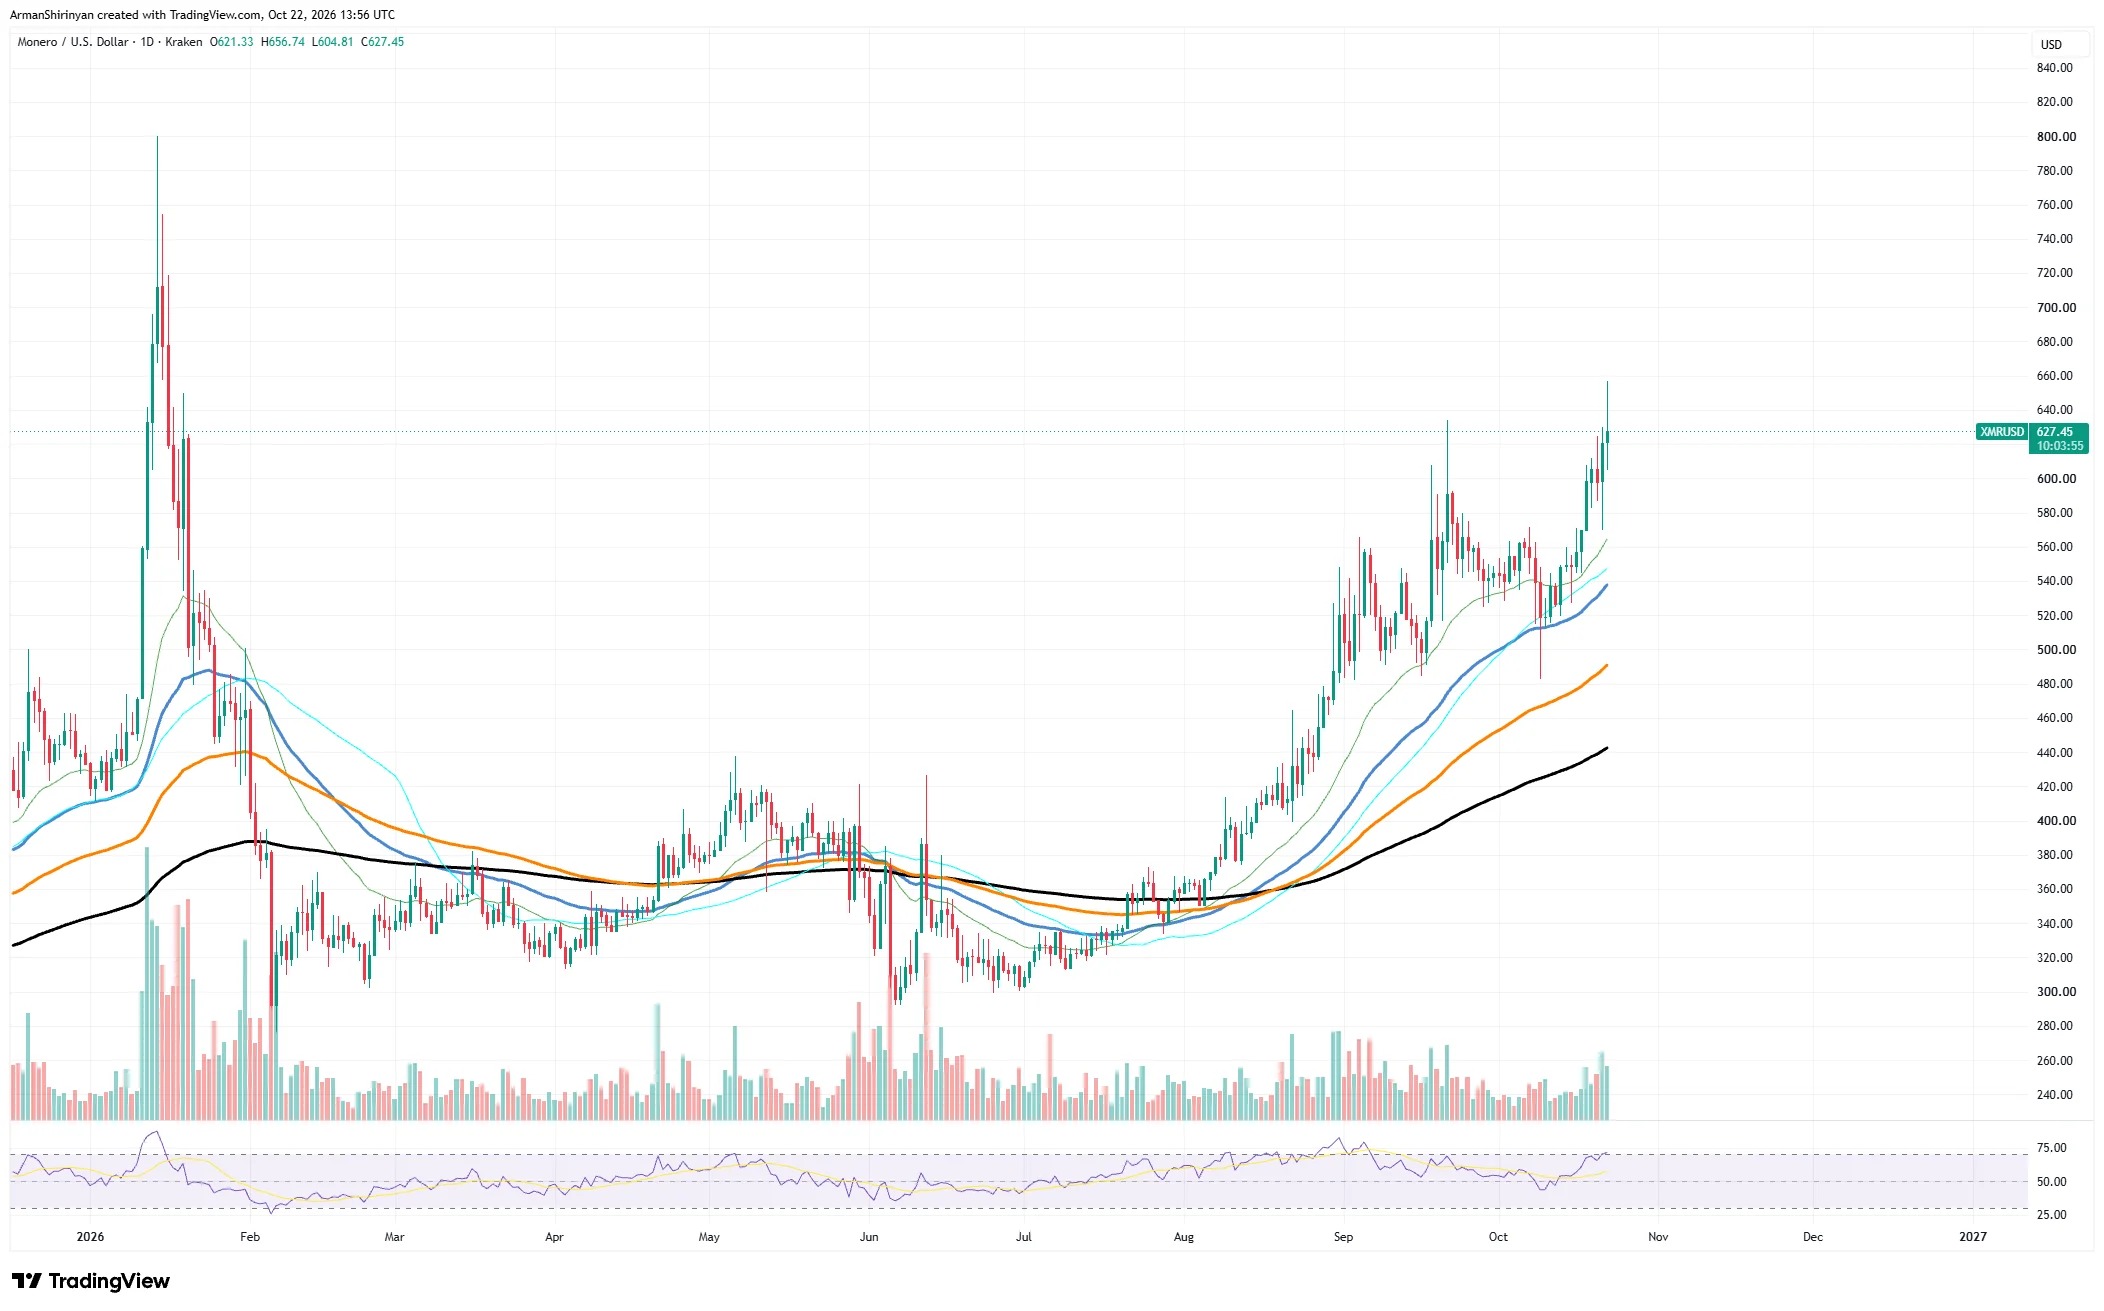
A strong trend usually first pulls back to the faster moving average before continuing to rise. The range from $565 to $540 may be where buyers first enter the market.
RSI is approaching 70, on the verge of overbought territory. This indicates strong upward momentum, but there may be a pause or cooling down. Trading volume has increased in the past few days, which provides support for a breakout.
On the upside, $656 is the first target, followed by $700. $800, near the January high, represents the main resistance level above there. On the downside, $565 is the first support level, followed by $540 and $490.
If XMR can hold above $635, buyers will still be in the dominant position. If it falls back below that level, this breakout may turn into a failed trend.
Stellar ( XLM ) fell below $0.18, with sellers continuing to dominate the trend
Stellar is currently showing poor performance. XLM reported a price of $0.1777 at Binance, which is lower than the opening price of $0.1838. The intraday range was very narrow, between $0.1768 and $0.1845, and buyers have not been able to sustain any rebound yet.
The currency has fallen from around $0.237 in late September to the current level, representing a decrease of about 25%. XLM is currently below all major moving averages, which are concentrated between $0.19 and $0.196. This area has now become a resistance zone.
Any rebound must first break through this area. Before that, it is more likely for the price to fall back rather than to form a trend reversal.
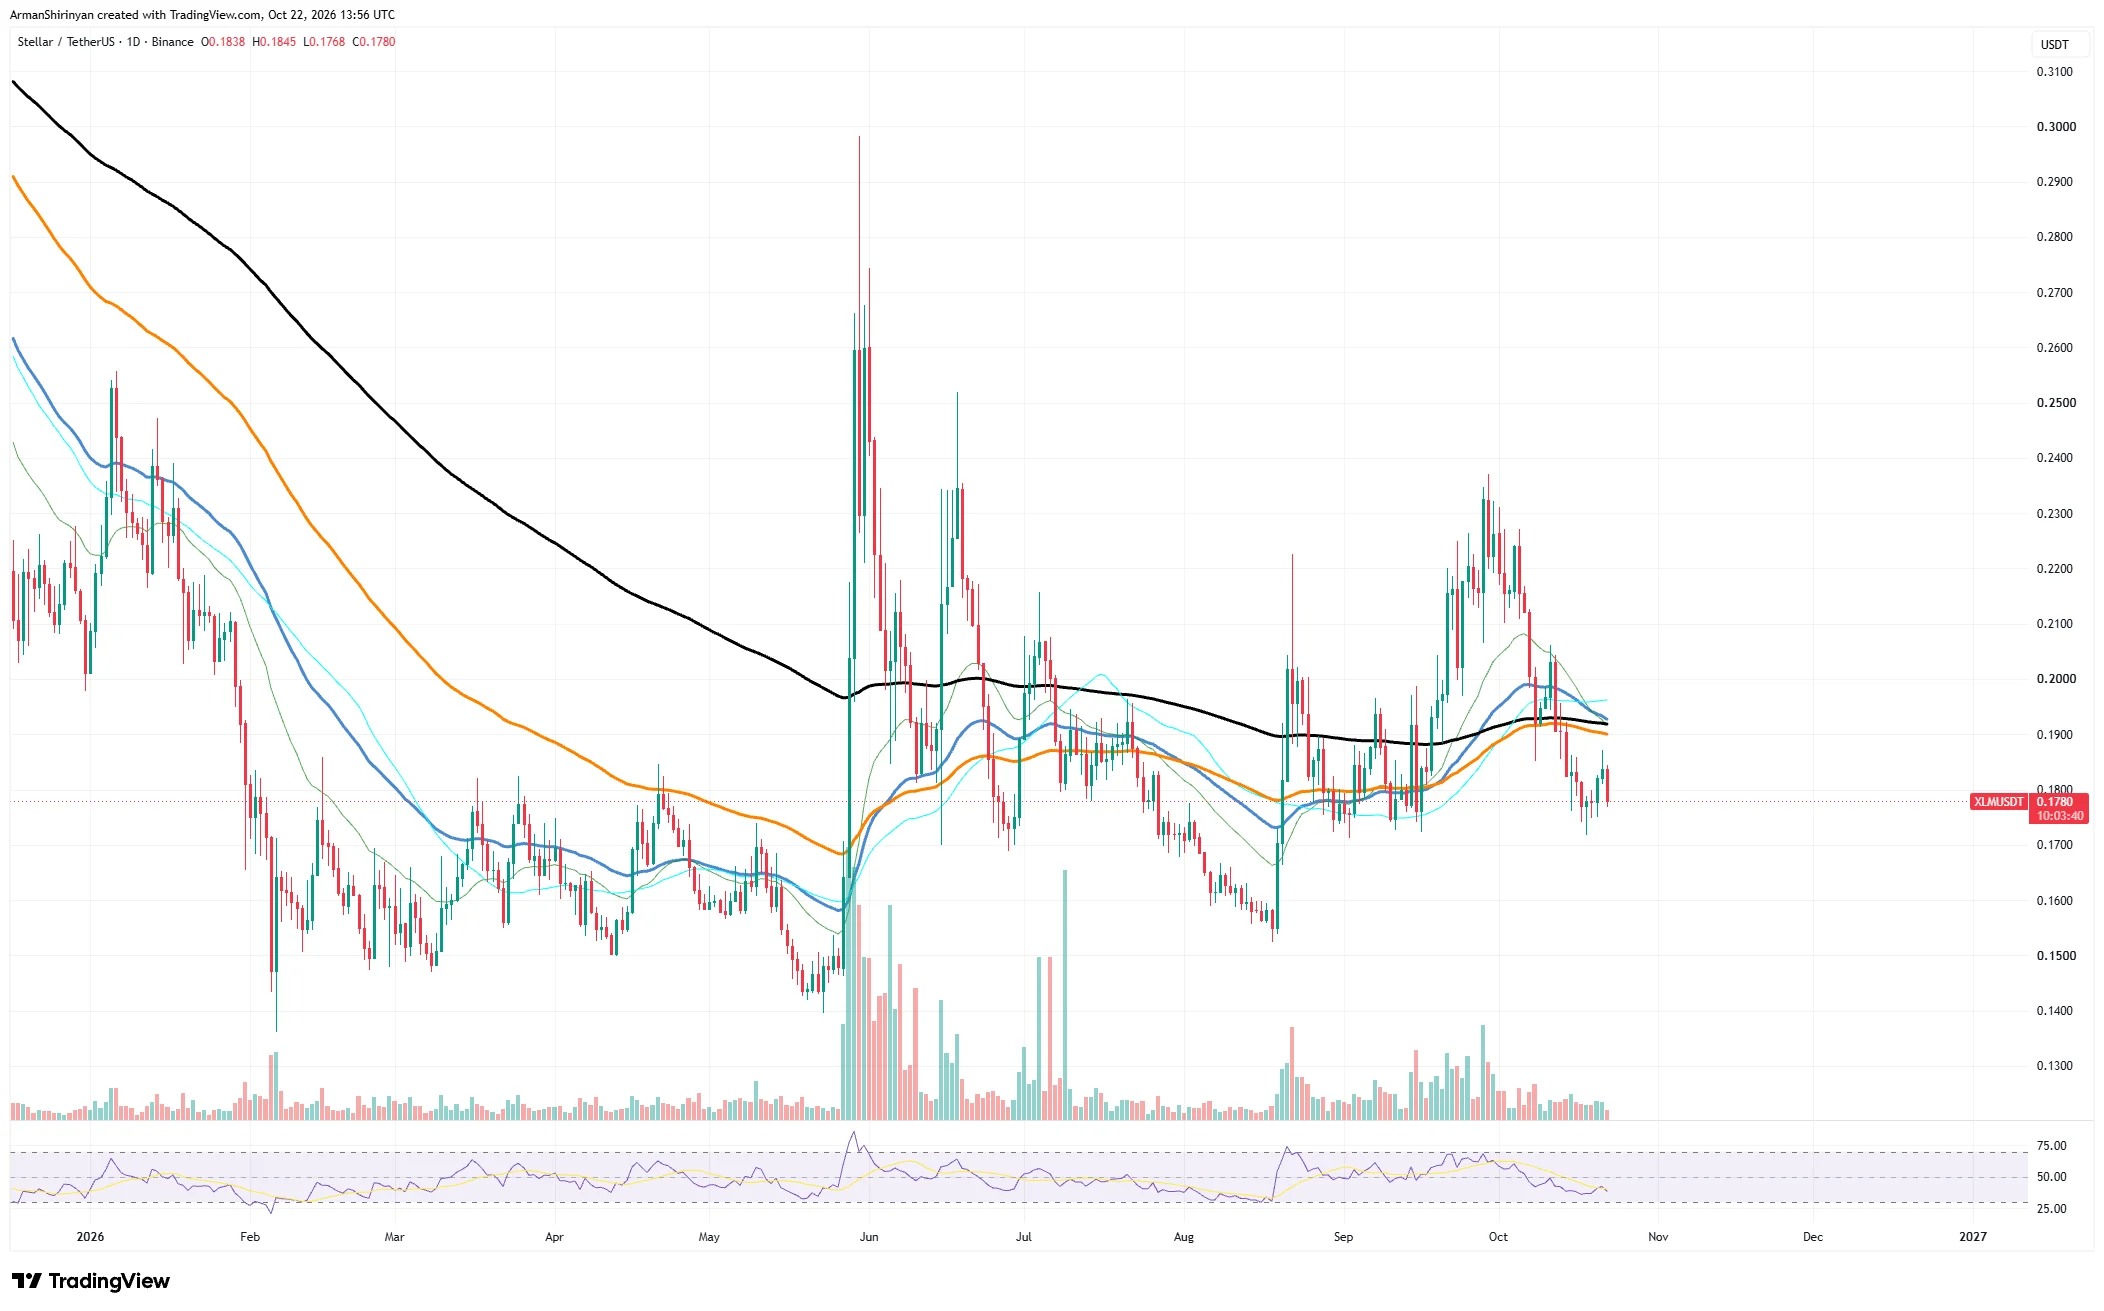
The recent support level is at $0.172, which is also where the price rebounded earlier this week. This low point is still holding, but the price is currently only about 3% below it. If it clearly breaks below this level, it could open the way for a decline to $0.17, or even to the August low of around $0.1525.
RSI is approaching 38, which is below the median line of 50. This indicates that sellers are in the dominant position, but we have not yet entered an oversold area, so there is still room for further decline. Trading volume has also been relatively low in recent weeks. Low trading volume means that traders are not very interested, and as a result, prices have been moving slowly downward.
If XLM rebounds, the first target is $0.19, followed by $0.20 and $0.22. Reaching $0.19 again will be the first sign that the downward trend has ended. If $0.172 cannot be held, the price may slide towards the lower edge of the summer range.
For now, it seems that XLM requires a significant increase in trading volume for the trend to possibly change.
Bitcoin ( BTC ) encounters resistance around $84,000
After encountering resistance at its intraday high, Bitcoin is currently hovering around $81,500. BTC opened near $84,000, reached a high of $84,294, and then fell to a low of $81,483. The bearish candlestick that closed the session erased the gains from the previous day, indicating that there is still active selling pressure above $84,000.
Since mid-September, Bitcoin has been trading within a wide range. The upper limit is close to $87,000, and the price failed to break through this level twice in September and early October; the lower limit is around $80,000, where buyers intervened at the beginning of this month. Now, the price is approaching the lower limit of this range.
Each rebound is weaker than the previous one, and the high points are also gradually moving lower. This is a small sign of weakening strength.
The shorter-term moving averages are concentrated between $80,800 and $82,500, with Bitcoin currently above these averages. This area serves as the first line of defense. The longer-term moving averages are still on the rise, but at lower levels, around $77,400 and $76,100 respectively.
All moving averages are pointing upwards, which indicates that the overall trend since the rebound in August remains bullish. The significant distance between the long-term moving averages and the current price also means that prices could experience further pullbacks without disrupting this trend.
RSI is approaching 43, below the median line of 50. Compared to the strong readings seen in late August and September, the momentum has slowed down. Trading volume is at an average level, with no signs of panic selling.
Support starts from $80,800, followed by $80,000, and then $77,400. If the daily closing price falls below $80,000, the price could drop to the range of $77,000 to $76,000. On the upside, Bitcoin needs to regain above $84,300 to have a chance to challenge $87,000.
For now, $80,000 is the most important level. As long as this position is held, the range structure remains valid.
Hyperliquid ( HYPE ) Testing key support levels
Hyperliquid is currently under pressure. HYPE was reported at $78.17 on Coinbase, with an opening price of $80.64 and a lowest point of $77.69. The current price is about 20% lower than the high of nearly $98 in late September.
After approaching $98, HYPE formed a series of lower highs. An attempt to rebound to $95 at the beginning of October failed, and since then, the price has been falling almost every week. Sellers have dominated the trend for about a month.
The price is also below the short-term and medium-term moving averages, which range between $82.5 and $85.8. This area has now become a resistance level, and any rebound must first break through this level.
The orange moving average, which is close to $77.60, is now at a key level. HYPE is currently trading almost at this level. A few days ago, the price touched this area and rebounded, but the rebound was very small and quickly faded away.
This is the third test in a short period of time. Each test on the support level makes it weaker. If it clearly breaks below that level, it will constitute a negative signal.
RSI is approaching 40, indicating weak momentum, but it has not yet entered an oversold state. There is still room for further price declines, and it may be that buyers have not yet reached the point to sell. Trading volume has dropped to a low level, suggesting that both parties lack strong confidence.
If the level of $77.60 is breached, the next support level will be around $75, which is also the low point seen earlier this month. Further down, the long-term moving average at around $65.50 will become the next major support area, indicating that there could be another decline of about 15%. On the upside, HYPE needs to regain $82.50 in order to reverse the short-term trend. After that, $85.80 and $90 will be the next targets.
In the long term, the trend is still upward, as prices are still significantly above the long-term moving average. However, in the short term, buyers must hold onto $77.60 to avoid a deeper pullback.