

After encountering a $6.3 billion hacker attack and a sell-off in tech stocks at Binance, Bitcoin still remains above $76,000, and momentum indicators suggest that it may see a rebound.
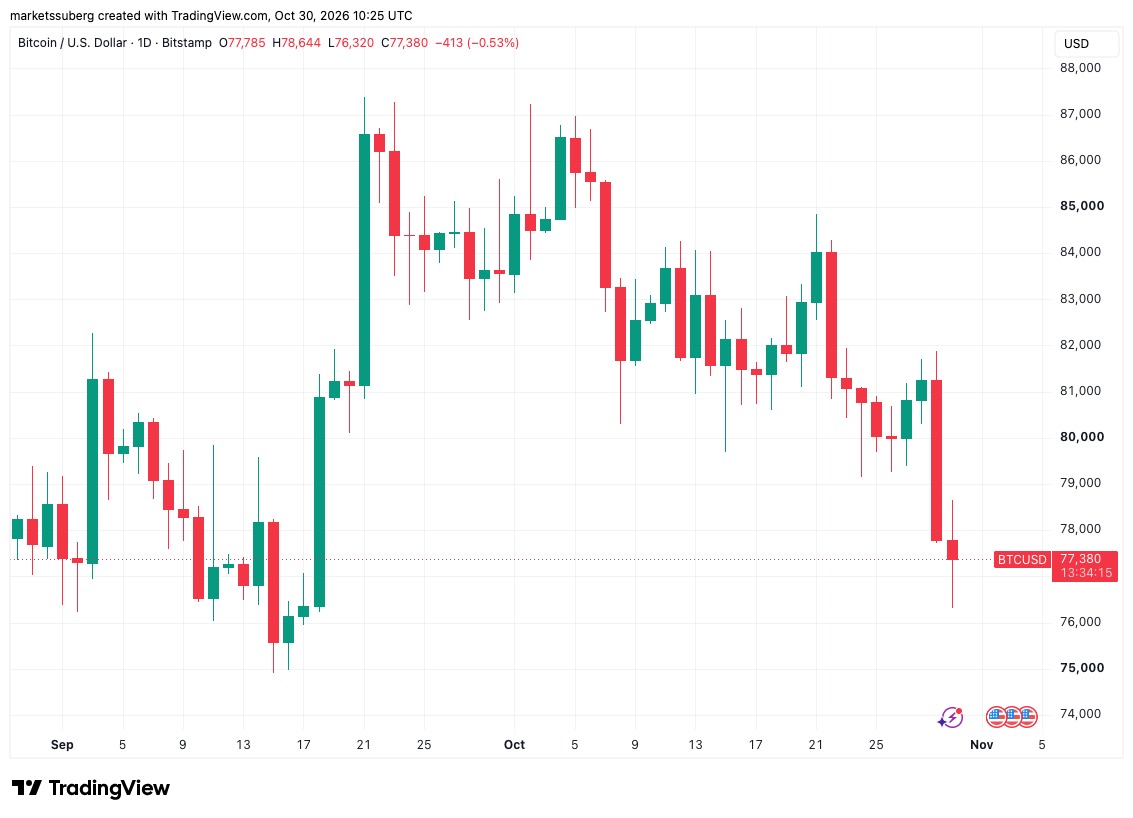
On Friday, the trading price of Bitcoin ( BTC ) exceeded $77,000, and the settlement volume in the crypto market over the past 24 hours surpassed $1.5 billion.
Key points:
- As the market digests the details of the $6.3 billion hacker attack (Binance), Bitcoin narrows its decline after falling to $76,320.
- As the fourth-quarter financial report expectations triggered a decline in tech stocks, the crypto market came under pressure. Intel Corporation ( INTC ) fell 26% before the market opened on Friday.
- After selling pressure fell below $77,000, a bullish divergence appeared on the four-hour chart of Bitcoin for the Relative Strength Index ( RSI ).
Selling of U.S. tech stocks intensified tensions in the crypto market after the Binance hacking incident
TradingView Data shows that as the market digests the subsequent impacts of Binance the world's largest cryptocurrency exchange suffering a $6.3 billion hacker attack, BTC / USD once fell to $76,320.
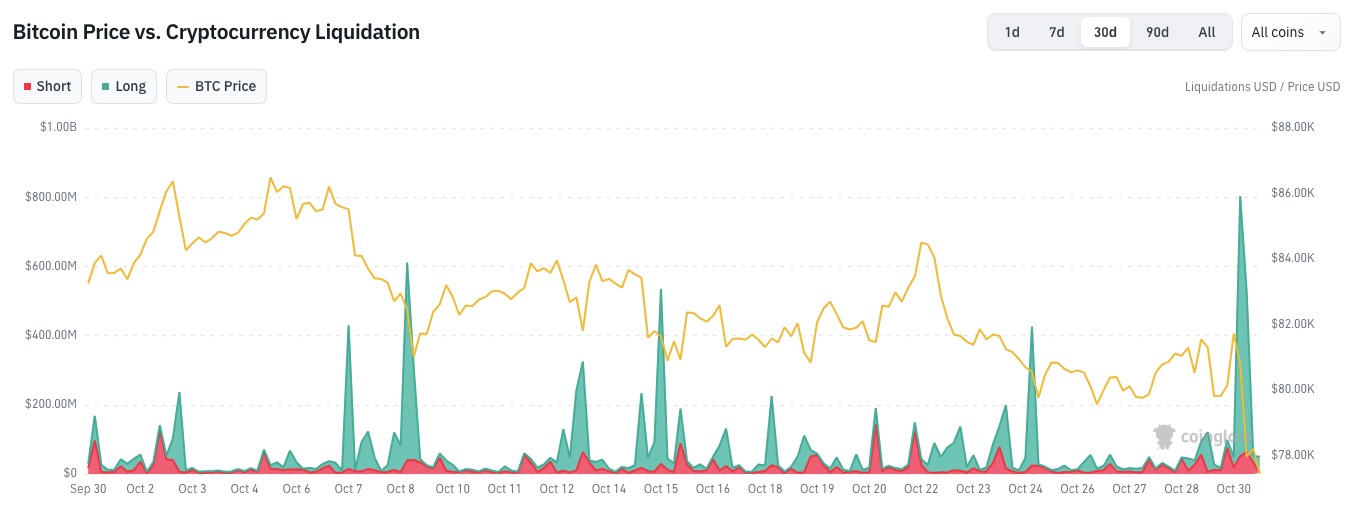
In the past 24 hours, the clearing volume of traders across the industry reached 1.56 billion US dollars. CoinGlass Data shows that the majority of this amount, 1.31 billion US dollars, came from long positions.
After the company confirmed that all user losses would be covered by a dedicated SAFU fund and other company resources, the subsequent momentum cooled down somewhat.
This hacking incident has compounded the macroeconomic pressures faced by the crypto market. Previously, on Thursday, the U.S. stock market fell due to tech companies' earnings not meeting expectations. Alphabet failed to meet its profit and revenue targets on Wednesday, followed by a 13% decline in GOOGL to $282, hitting its lowest level since April.
Bitcoin shows a bullish divergence at local lows
In a shorter time frame, Bitcoin price indicators have returned to levels not seen since the end of June when they fell to multi-year lows near $57,000 BTC / USD.
On Thursday, the price closed below the lower band of the Bollinger Bands indicator, a phenomenon that has not occurred since June 25th. This indicates that trading prices are more than two standard deviations below the 20-day simple moving average ( SMA ). Although the Bollinger Bands themselves do not provide buying or selling signals, closing below the lower band may suggest that prices are likely to return to their average level. Currently, the 20-day SMA is at $81,324.
On the four-hour chart, RSI shows a bullish divergence relative to the Bitcoin price, meaning that BTC / USD have created lower lows, while RSI has formed a higher swing low. Such a divergence may indicate a weakening of sellers' control and could lead to a change in the local trend.
Related topics
- Binance Hackers hold more Bitcoin than the corporate vault of Coinbase
- Trezor Warning: CryptoBilis Buyer, funds transfer is required due to suspicion of implants.
- Strategy plans to continue increasing its holdings of Bitcoin, while Saylor claims to have a credit capacity of $30 billion.