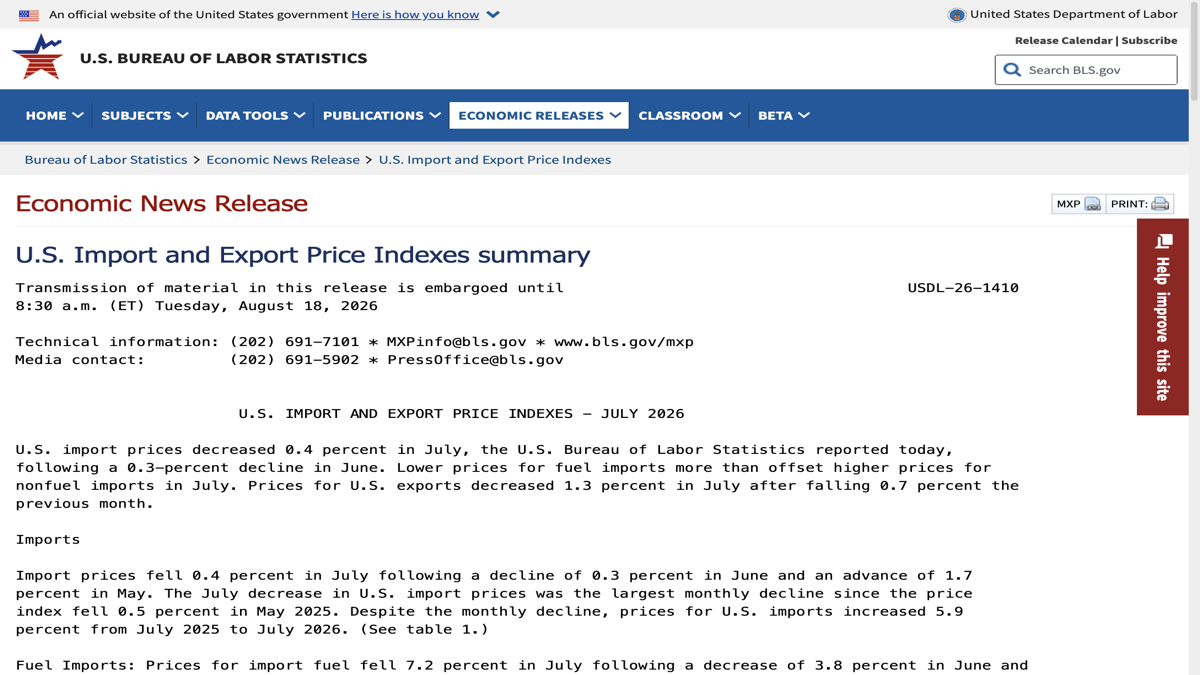
The Import and Export Price Index released by the U.S. Bureau of Labor Statistics in August shows that import prices fell by 0.4% month-on-month in July, following a 0.3% decline in June; export prices fell by 1.3% month-on-month, compared to a 0.7% drop in June. Over the past 12 months, import prices have still risen by 5.9%, while export prices have increased by 8.2%. The fact that the same set of data exhibits both “month-on-month declines” and “year-on-year increases” illustrates that price analysis cannot focus solely on the most prominent figure. Month-on-month comparisons describe short-term changes, while year-on-year comparisons reflect cumulative changes over a year; both provide different insights.
Import prices are not a simple substitute for consumer prices among residents. They are influenced by factors such as energy, industrial supplies, consumer goods, exchange rates, global freight costs, and contract pricing. By the time they reach the final retail price, they also go through various stages including inventory, wholesale, taxes, profits, and competitive conditions. Export prices are not merely the costs of American companies; they reflect changes in the pricing of goods and services for overseas markets. Therefore, a decline in import prices does not necessarily mean that CPI will immediately fall, and a decrease in export prices does not necessarily imply a weakening of external demand overall.
Monthly fluctuations should be understood in the context of composition and base numbers.
The monthly price index may be driven by significant fluctuations in a few commodities. Changes in energy prices often have a noticeable impact, but industrial raw materials, automobiles, capital goods, agricultural products, and services also have their own cycles. When analyzing, it is important to consider which categories contributed to the changes, whether there is a consistent trend over several months, and how seasonal adjustments and base periods are handled. To interpret a 0.4% decline in import prices as "inflation has been resolved" would ignore the context of a year-on-year increase of 5.9% and the potentially very different trends among different categories.
For enterprises, import prices serve as signals of supply chain costs rather than automatic instructions to reduce prices. Procurement departments need to distinguish between locked-in contracts and spot prices, foreign currency payment exposures, transportation cycles, and inventory coverage days; even if indices decline, companies may still experience increased costs due to exchange rates or shortages of specific components. Exporting firms, on the other hand, must consider overseas demand, competitor pricing, and exchange rates in their decisions, rather than relying solely on the overall export price index. Macroeconomic statistics provide a direction, but business decisions must ultimately be based on their own product categories and contracts.
The most important thing to look at in price data is whether the transmission continues.
The short-term market often looks for "turning points," but a more valuable question is whether the price decline can be sustained, whether it will spread to more categories, and whether it will ultimately affect corporate profits and consumer spending. There are connections between import prices, producer prices, consumer prices, wages, and inflation expectations, but there is no fixed one-to-one relationship. Policies, exchange rates, tariffs, geopolitical transportation risks, and changes in demand can all alter the speed of these transmissions.
Therefore, this July data should be accurately interpreted as a signal that external price pressures have eased during that month, rather than a conclusion about the future inflation trajectory. Only if the trend continues to decline in subsequent months, becomes more widespread, and is corroborated by other price indicators will the judgment be more solid; if energy prices or exchange rates reverse again, the improvement in a single month could quickly be offset. By clarifying the time frame and the boundaries of the indicators, price news can truly help readers understand the risks, rather than creating an premature story of “inflation over.”
Exchange rates are variables that are particularly easy to overlook when understanding import prices. Changes in the US dollar can alter the cost of imports denominated in dollars, even if the local currency quotes of overseas producers remain unchanged; conversely, changes in overseas prices may also be partially offset by exchange rates. If businesses and investors make decisions based solely on overall indices, they may miss the differences between their contract currencies and the actual sources of their purchases. A more comprehensive analysis should take into account commodity prices, exchange rates, transportation costs, and inventory cycles, and focus on whether price reductions are actually passed on to purchase orders rather than merely reflected during the statistical period.
Export prices also need to be considered separately from the volume of exports. Price declines can sometimes result from increased competition or reduced costs, and at other times, they may be due to companies adjusting their pricing to maintain market share. Only by combining export volume, orders, and overseas demand can we assess the impact on revenue. Statistical releases provide a reflection of the situation, but they cannot replace in-depth studies of the trade structure. A sound macroeconomic analysis does not equate one indicator with the fate of all industries; instead, it waits for more indicators to provide cross-validation.
Price changes may also be absorbed at different points in the supply chain. Importers, wholesalers, and retailers will decide whether to adjust their end-user prices based on competition, inventory, and contractual arrangements, and this transmission can be delayed by several months. If companies rely on overseas procurement, they need to combine the index with their own procurement currency, delivery periods, product categories, and hedging strategies; they cannot use the national average as an accurate cost budget. For policy monitoring purposes, it is also necessary to track the prices of core commodities, energy, and services simultaneously, rather than regarding import indices as the sole indicator.
If future data shows a decline, it will mainly be concentrated in a few categories of volatility, which has a completely different macroeconomic meaning from a widespread downturn; if the year-on-year figures remain high, the annual cost pressures on businesses may not be alleviated immediately. To accurately interpret the released data, it is first necessary to respect the scope that it describes.
For readers, the most prudent approach is to continue observing the trends rather than making bets on the long-term path based on a single month-over-month change.
The power of this type of data comes from continuous comparison, rather than a single prominent figure in a single release.
Attention should also be paid to subsequent revisions. The monthly trade price index will be updated with additional information, and the initial reported changes are not set in stone. If news reporting only records the initial figures without explaining the statistical methodology, it can give readers an impression of certainty that is not warranted. A truly useful way to track trends is to place the initial values, revised values, and the direction over consecutive months on the same timeline, in order to determine whether external cost pressures are merely a temporary respite or if they are forming a broader downward trend.