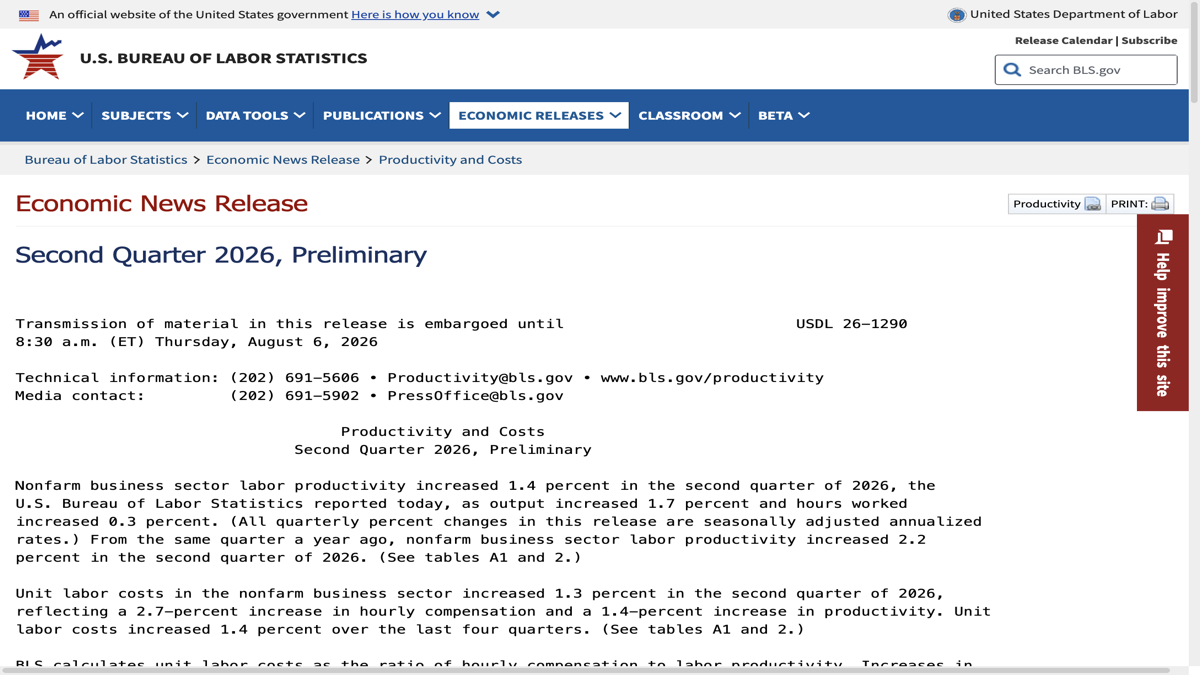
Data on industry productivity and costs released by the U.S. Bureau of Labor Statistics in August indicated that in the second quarter of 2026, productivity in the non-agricultural business sector grew at an annual rate of 1.4%, while unit labor costs increased by 1.3%; productivity in manufacturing grew by 1.9%, and unit labor costs remained unchanged. Data from the service provision industry remind us that productivity is not a concept that belongs solely to factories and robots. In the service sector, industries such as software, logistics, finance, medical support, after-sales customer service, and professional services also improve the efficiency of output per unit through process optimization, capital investment, and labor organization.
The basic meaning of productivity is the change in output corresponding to a unit of labor input, but it should not be misinterpreted as a single indicator of employees working “ harder” or companies having “higher profits.” Output estimates, man-hours, industry price adjustments, capital utilization, and business mix all affect the results. A rise over a quarter may stem from genuine technological improvements, or it could also include cyclical recoveries, changes in demand patterns, or data revisions. Especially in the service sector, where measuring output quality and intangible inputs is inherently complex, extra caution is required when comparing different industries.
Unit labor cost puts efficiency and compensation on the same chart
Unit labor cost reflects the relative relationship between increases in labor remuneration and productivity growth. In the second quarter, unit labor costs in the non-agricultural commercial sector increased by 1.3%, which means that even though productivity has improved, the cost pressure has not automatically disappeared; the stabilization of unit labor costs in manufacturing does not indicate that the costs for all manufacturing enterprises have remained unchanged. Wages, working hours, raw materials, financing, and equipment costs vary within different industries, and aggregate indicators can only provide a macroscopic direction.
For observers of monetary policy and inflation, an increase in productivity is generally seen as a positive factor, as the same amount of labor input can produce more goods and services, which theoretically helps to alleviate cost pressures. However, this transmission effect depends on competition, demand, pricing power, and wage distribution. If demand grows rapidly simultaneously, companies may still raise prices; if the benefits of efficiency improvements are concentrated among a few firms, the overall labor market may only experience limited improvements. To simply conclude that an increase in productivity necessarily leads to a decrease in inflation or that wages do not need to rise is an inference that overlooks the evidence.
Whether investment in AI is efficient must be verified by operational data.
Artificial intelligence and automation are often used to explain changes in productivity, but quarterly statistics cannot distinguish which increases come from AI, which come from traditional software, equipment updates, industry reorganizations, or economic cycles. To prove that AI brings about productivity, companies should not just show the number of deployments, but also track the time required to complete the same tasks, error rates, rework rates, customer experience, and additional maintenance costs. While models may speed up certain processes, they may also increase investments in auditing, data governance, and security; the net benefits need to be calculated over a full operational cycle.
The most noteworthy conclusion from this second-quarter report is that productivity and unit labor costs provide important information for understanding the quality of growth, but neither is a metric that can be used to make qualitative judgments in a single quarter. It is necessary to continuously observe data over multiple periods, industry segments, and sources of output in order to determine whether improvements in efficiency have truly spread. For business managers, the most practical approach is to use macro-productivity as a backdrop and then use their own auditable task indicators to assess whether technological investments are worth expanding, rather than relying solely on national statistics as a basis for making business decisions.
It is also important to pay attention to the distribution of productivity improvements. Companies may reduce waiting times and rework through process optimization, or they may transfer some tasks to outsourcing, customers, or automated systems; the impacts of these approaches on employee experience, service quality, and long-term innovation differ. If only hourly output is pursued, long-term investments such as training, maintenance, data quality, and customer trust may be overlooked. Good efficiency improvements should allow employees to shift their time from repetitive labor to more valuable judgment and service, rather than simply cramming more tasks into the same amount of working hours.
After the release of macro data, the most advisable approach is to compare the revised continuous sequences and to observe whether similar improvements have occurred in different industries. If only a few sectors are driving growth, policies and corporate strategies cannot assume that all sectors have equal potential for improvement. Productivity is a result, not a synonym for some technical term; whether investments in AI, software, management, and capital are effective must ultimately be proven by actual output, costs, and quality.
Service industry productivity is also related to the measurement of quality. The value of many services is not entirely reflected in quantity; for example, reduced customer waiting times, fewer errors, expanded coverage, or improved experiences all require additional indicators to be observed. When conducting internal evaluations, companies should track speed, quality, compliance, and employee workload simultaneously to avoid misinterpreting faster task processing as an improvement in efficiency if such actions lead to an increase in complaints or rework. Macroeconomic statistics can provide a direction, but micro-management still requires more detailed operational data.
If technical investments increase training and migration costs in the short term, they should not be immediately deemed a failure. The key is to measure the investment, the transition period, and the eventual sustainable benefits separately, and to allow the project to scale back or adjust its approach when there is insufficient evidence.
Only when both multi-period data and quality indicators improve simultaneously can it be more confidently referred to as an efficiency upgrade.
Therefore, the verification value brought by the next set of data is usually higher than that of a single optimistic interpretation based on a headline alone.
From a management perspective, productivity projects also need clear benchmarks: what were the man-hours, costs, errors, and customer outcomes for completing a task before deployment, and how much has changed after deployment? Without benchmarks, it is difficult to verify any claims of "time savings." National statistics are suitable for judging the overall economic trend, but it is the continuous records of a company itself that determine whether a tool should be scaled up, paused, or discontinued. Separating these two types of evidence can help avoid chasing abstract concepts and also prevent missing out on truly effective improvements.