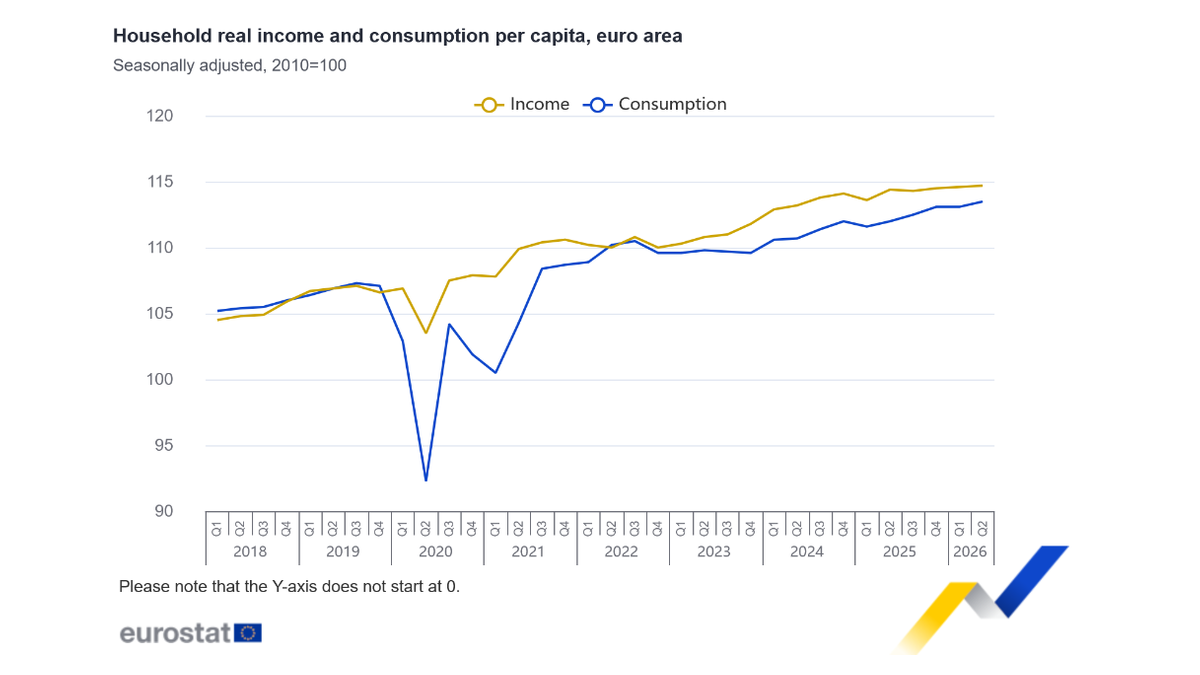


In the same family budget, both income and expenses did not accelerate together. According to the [second-quarter sector accounts released by Eurostat on October 28th]( https :// ec.europa.eu / eurostat / web / products-euro-indicators /w/2-28102026- ap ), real household income per capita in the eurozone increased by 0.1% on a quarter-on-quarter basis, while real consumption per capita increased by 0.3%; in the first quarter, these figures were 0.1% and flat respectively. These are seasonally adjusted quarterly data that compare purchasing power and consumption levels, and should not be directly interpreted as paychecks or store sales figures.
The range of "per capita actual income" is also broader than the net salary received. The calculation uses the adjusted total disposable household income, which is then divided by the population and the actual final consumer price index for households, taking into account factors such as in-kind social transfers provided by the public sector. Therefore, it is possible for an employee to feel that their salary has not changed, while at the same time, there can be a slight increase in macro-level per capita actual income.
A higher increase in consumption than income does not automatically indicate that households have started to borrow on a large scale. The report provides a more direct clue: the savings rate in the eurozone dropped from 14.4% in the first quarter to 14.2%, a decrease of 0.2 percentage points. The relationship between income and consumption also needs to take into account how much money is set aside during the current period.
The total amount is growing slowly, and the internal driving forces have changed.
What can more significantly change the initial impression is the source of income. According to the statistical bureau, the slight increase in per capita real income in the eurozone is mainly due to the positive contribution from net property income and other regular net transfers, while the total operating surplus and total mixed income are the biggest negative contributing factors. Describing a 0.1% increase as "a general recovery in wage purchasing power" overlooks the question of where this income actually comes from.
The overall income of the EU also increased by 0.1%, and consumption grew by 0.4%. However, the main contribution to this income growth came from employee compensation and non-monetary social benefits, while the greatest negative contribution came from regular taxes and net social contributions. Behind the same rate of income growth, the impact on households can vary. The eurozone and the EU cover different member states, so it is not appropriate to treat these two groups as the same set of households for repeated verification.
Regional differences in savings rates further break down the averages. Among the member countries that disclosed data, four countries saw an increase, while eleven saw a decrease; Poland and the Czech Republic each increased by 0.6 percentage points, and Finland decreased by 1.6 percentage points. This indicates that changes in the proportion of household funds retained are not synchronized, and therefore, it is not appropriate to label each country with a uniform measure of consumer confidence based on this data.
The savings rate has dropped from 14.4% to 14.2%, indicating that the proportion of income set aside has slightly decreased. However, this does not necessarily mean that households have spent a large portion of their past savings. To determine whether the funds come from current income, existing deposits, or loans, we also need a balance sheet, credit information, and more detailed national data. This sectoral account confirms that consumption growth has outpaced income and that the savings ratio has declined, but it does not provide information on each household's financing methods separately. To attribute a change in the overall amount to a single motive would be beyond what the data can answer.
Actual indicators also separate price from quantity. Nominal expenditures may increase due to rising prices, while actual consumption attempts to reflect changes in the volume of consumption; actual income is also adjusted for prices. For judging domestic demand, this is closer to purchasing power than just looking at retail amounts, but it is still an average per capita. Population structure, income distribution, and public physical services all affect individual experiences, so 0.1% and 0.3% are suitable for describing macro trends, but not for estimating how much more money a particular household has spent.
Revise by changing the starting point of comparison first.
There is another easily overlooked change in the continuity analysis. The statistical bureau revised the growth rate of per capita real income in the eurozone for the first quarter from 0.0% to 0.1%, and for the European Union from 0.1% to 0.3%. If one directly compares the figures from the previous report for the first quarter with these latest quarterly figures, it may mistake these data revisions for actual economic changes.
When viewed using the same series, income growth in the eurozone remains slow, with consumption shifting from stagnation in the first quarter to an increase; in the EU, income growth has slowed down, and consumption has turned from decline to growth. These two paths do not follow the same rhythm, and it is not sufficient to declare a consumer boom based on just one quarter of data.
Although the revision range is only 0.1 or 0.2 percentage points, it is sufficient to change the description from "stagnation" to "growth." In subsequent quarterly releases, the figures for the second quarter may also be adjusted further. Therefore, when judging trends, it is important to maintain a continuous series of the same version and record the initial values and revised values separately, rather than focusing solely on the most prominent growth rate for that quarter.
For those who focus on domestic demand, this report changes the starting point for evaluating evidence. One must first look at real purchasing power, then at sources of income and savings, in order to understand why expenditures are outpacing income. The balance between current consumption and capital retention for households has shifted, and how long this shift can be sustained cannot be determined by a simple increase in total amounts.