

As public attention shifts from Bitcoin, which has been in a sideways consolidation phase, to assets with higher volatility, Bitcoin's long-term indicators have already completed a transition to a deep cyclical bottom stage.
The analysis platform Lookonchain has discovered a synchronization signal: in past macroeconomic cycles, this signal has opened the door to the largest-scale upward trends. That is, the asset price simultaneously falls into the strongly undervalued areas indicated by Dynamic Rainbow Chart (dynamic rainbow chart) and 200 - week moving average heatmap (200-week moving average heat map, 200WMA Heatmap).
Historically, this moment signifies only one thing: retail speculators have finally lost interest in the long-term sideways trend, and it has been replaced by the steady absorption by large strategic participants.
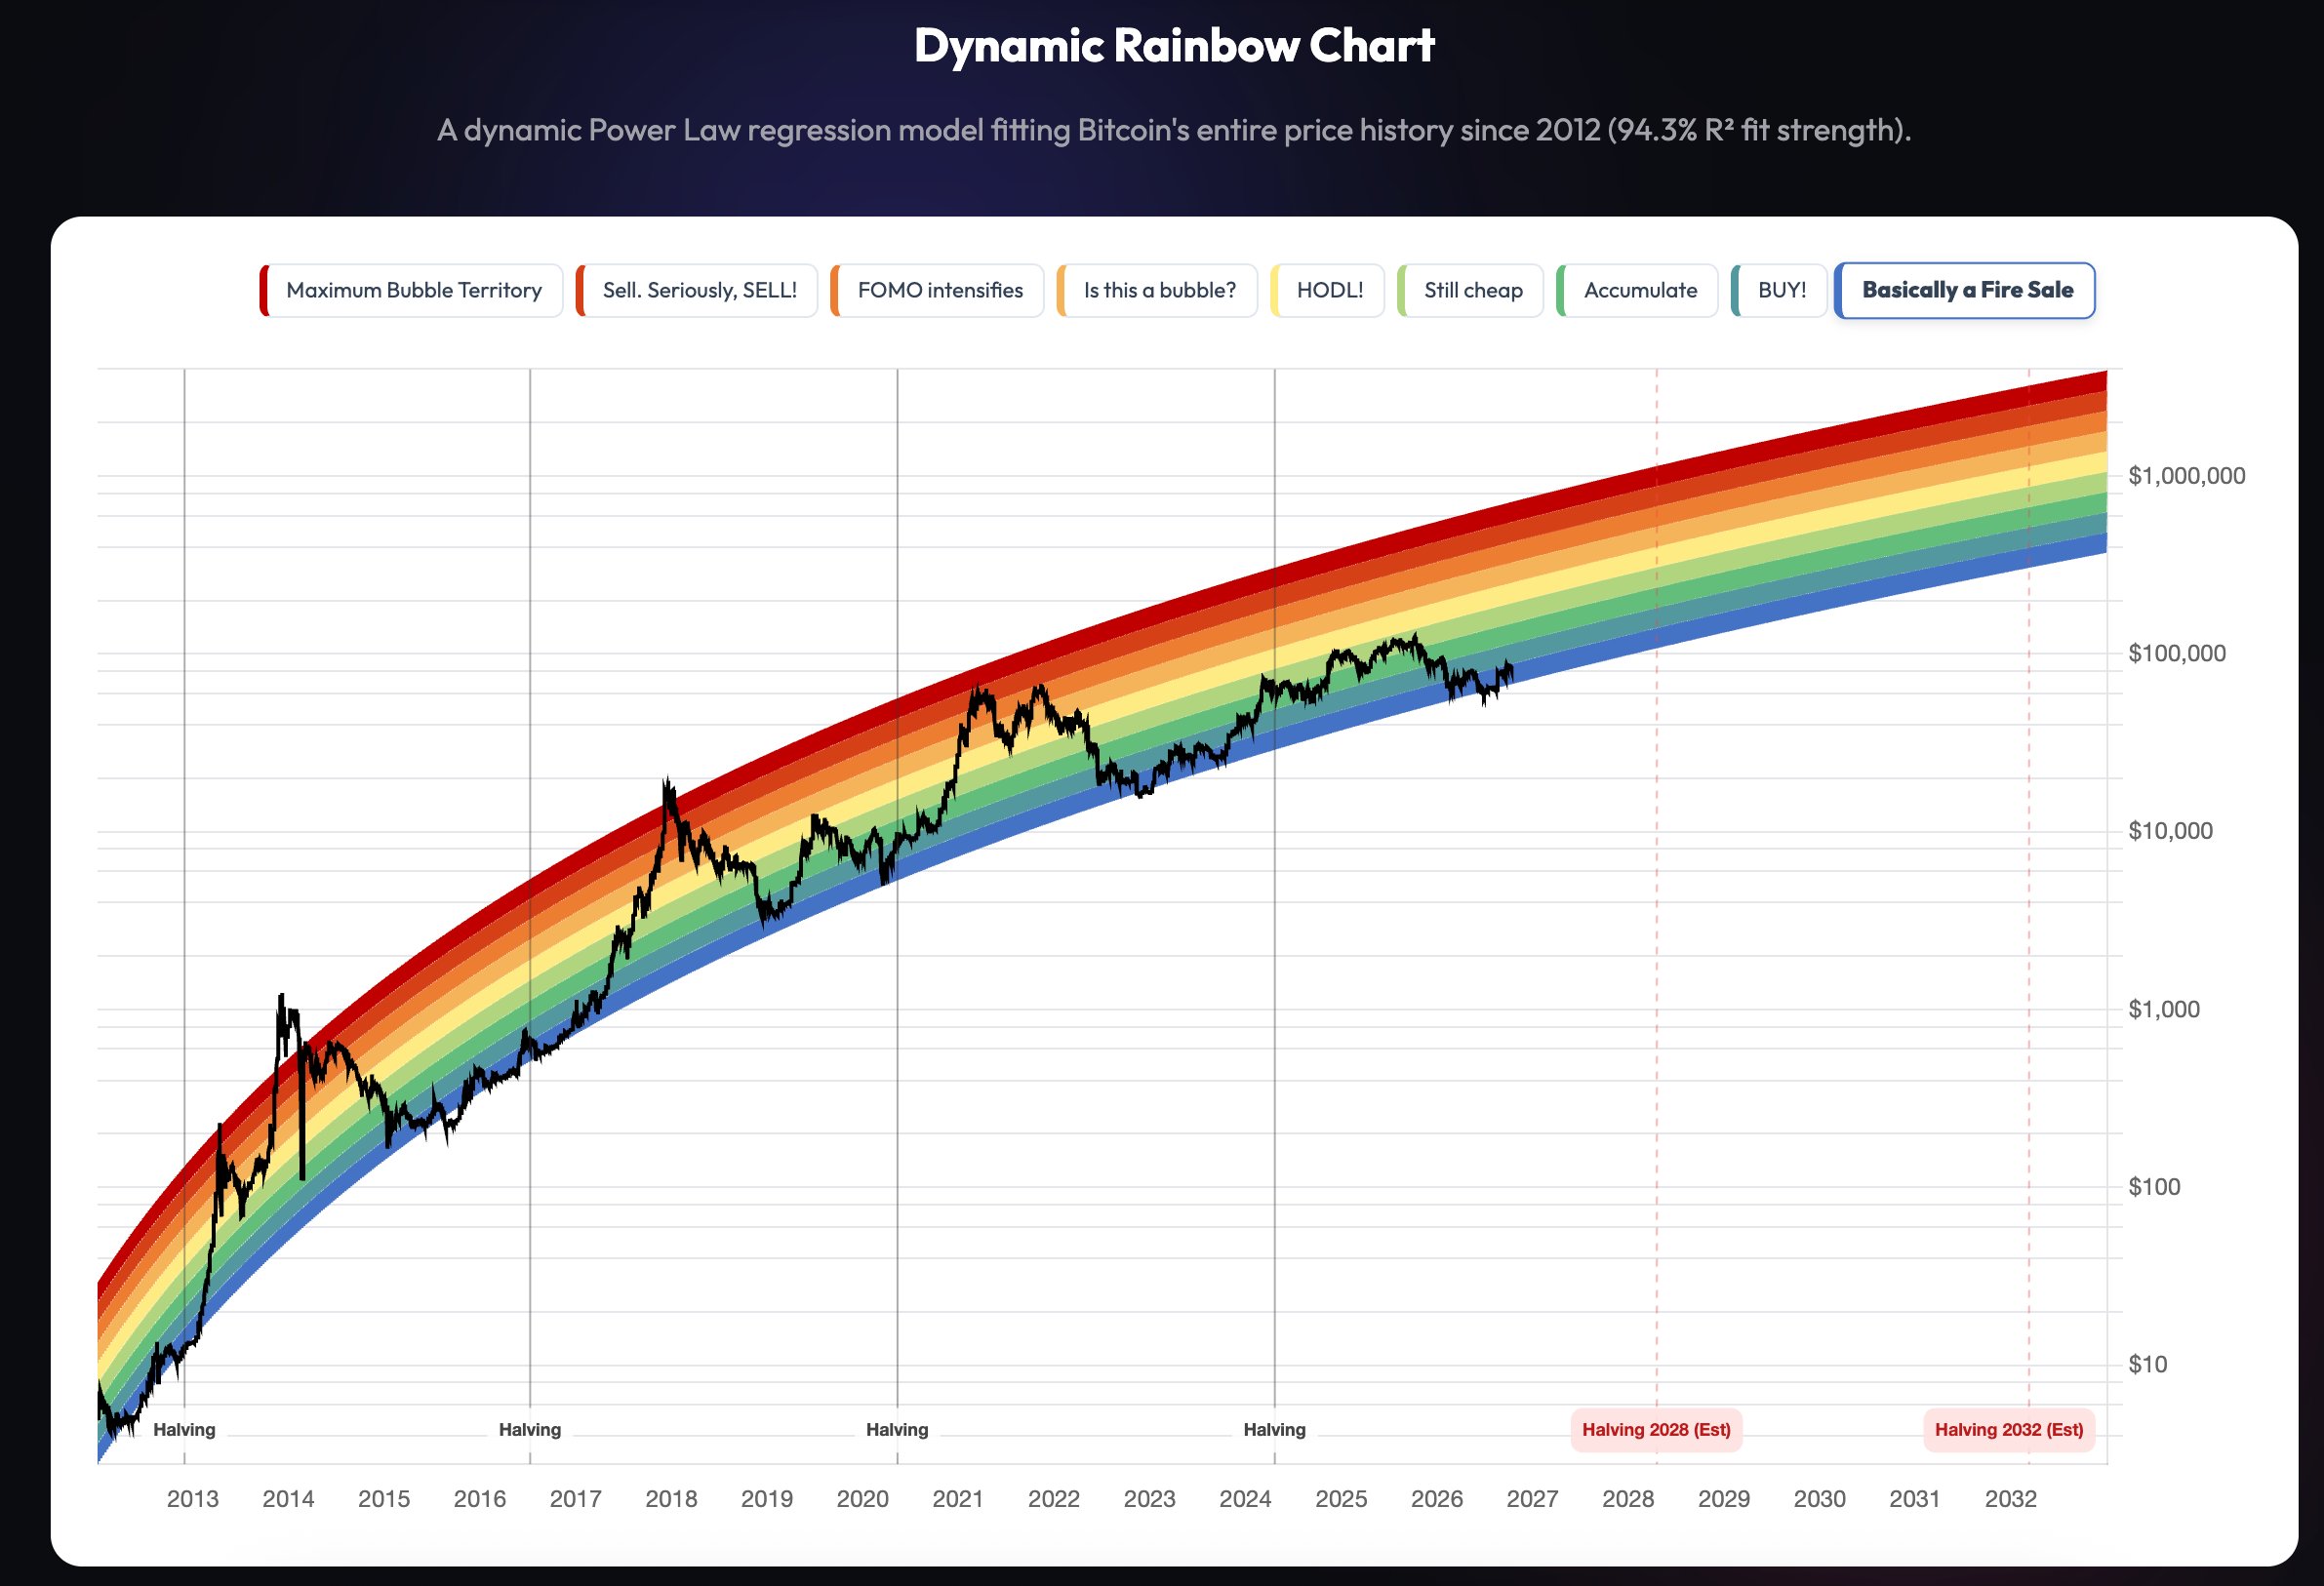
According to the article, Bitcoin's current trajectory in the Dynamic Rainbow Chart model is determined through rigorous power-law regression calculations. Since 2012, this model has had an accuracy rate of 94.3% in describing the behavior of this asset.
Currently, the price chart of BTC is almost at the very bottom of this mathematical “rainbow,” resting at the junction of the two ranges between “BUY!” and “Basically a Fire Sale.” From the perspective of this model, the price has been compressed to its limit, offering investors the greatest discount relative to its fair value; at the same time, the theoretical peak for the next round of market overheating has already far exceeded one million US dollars.
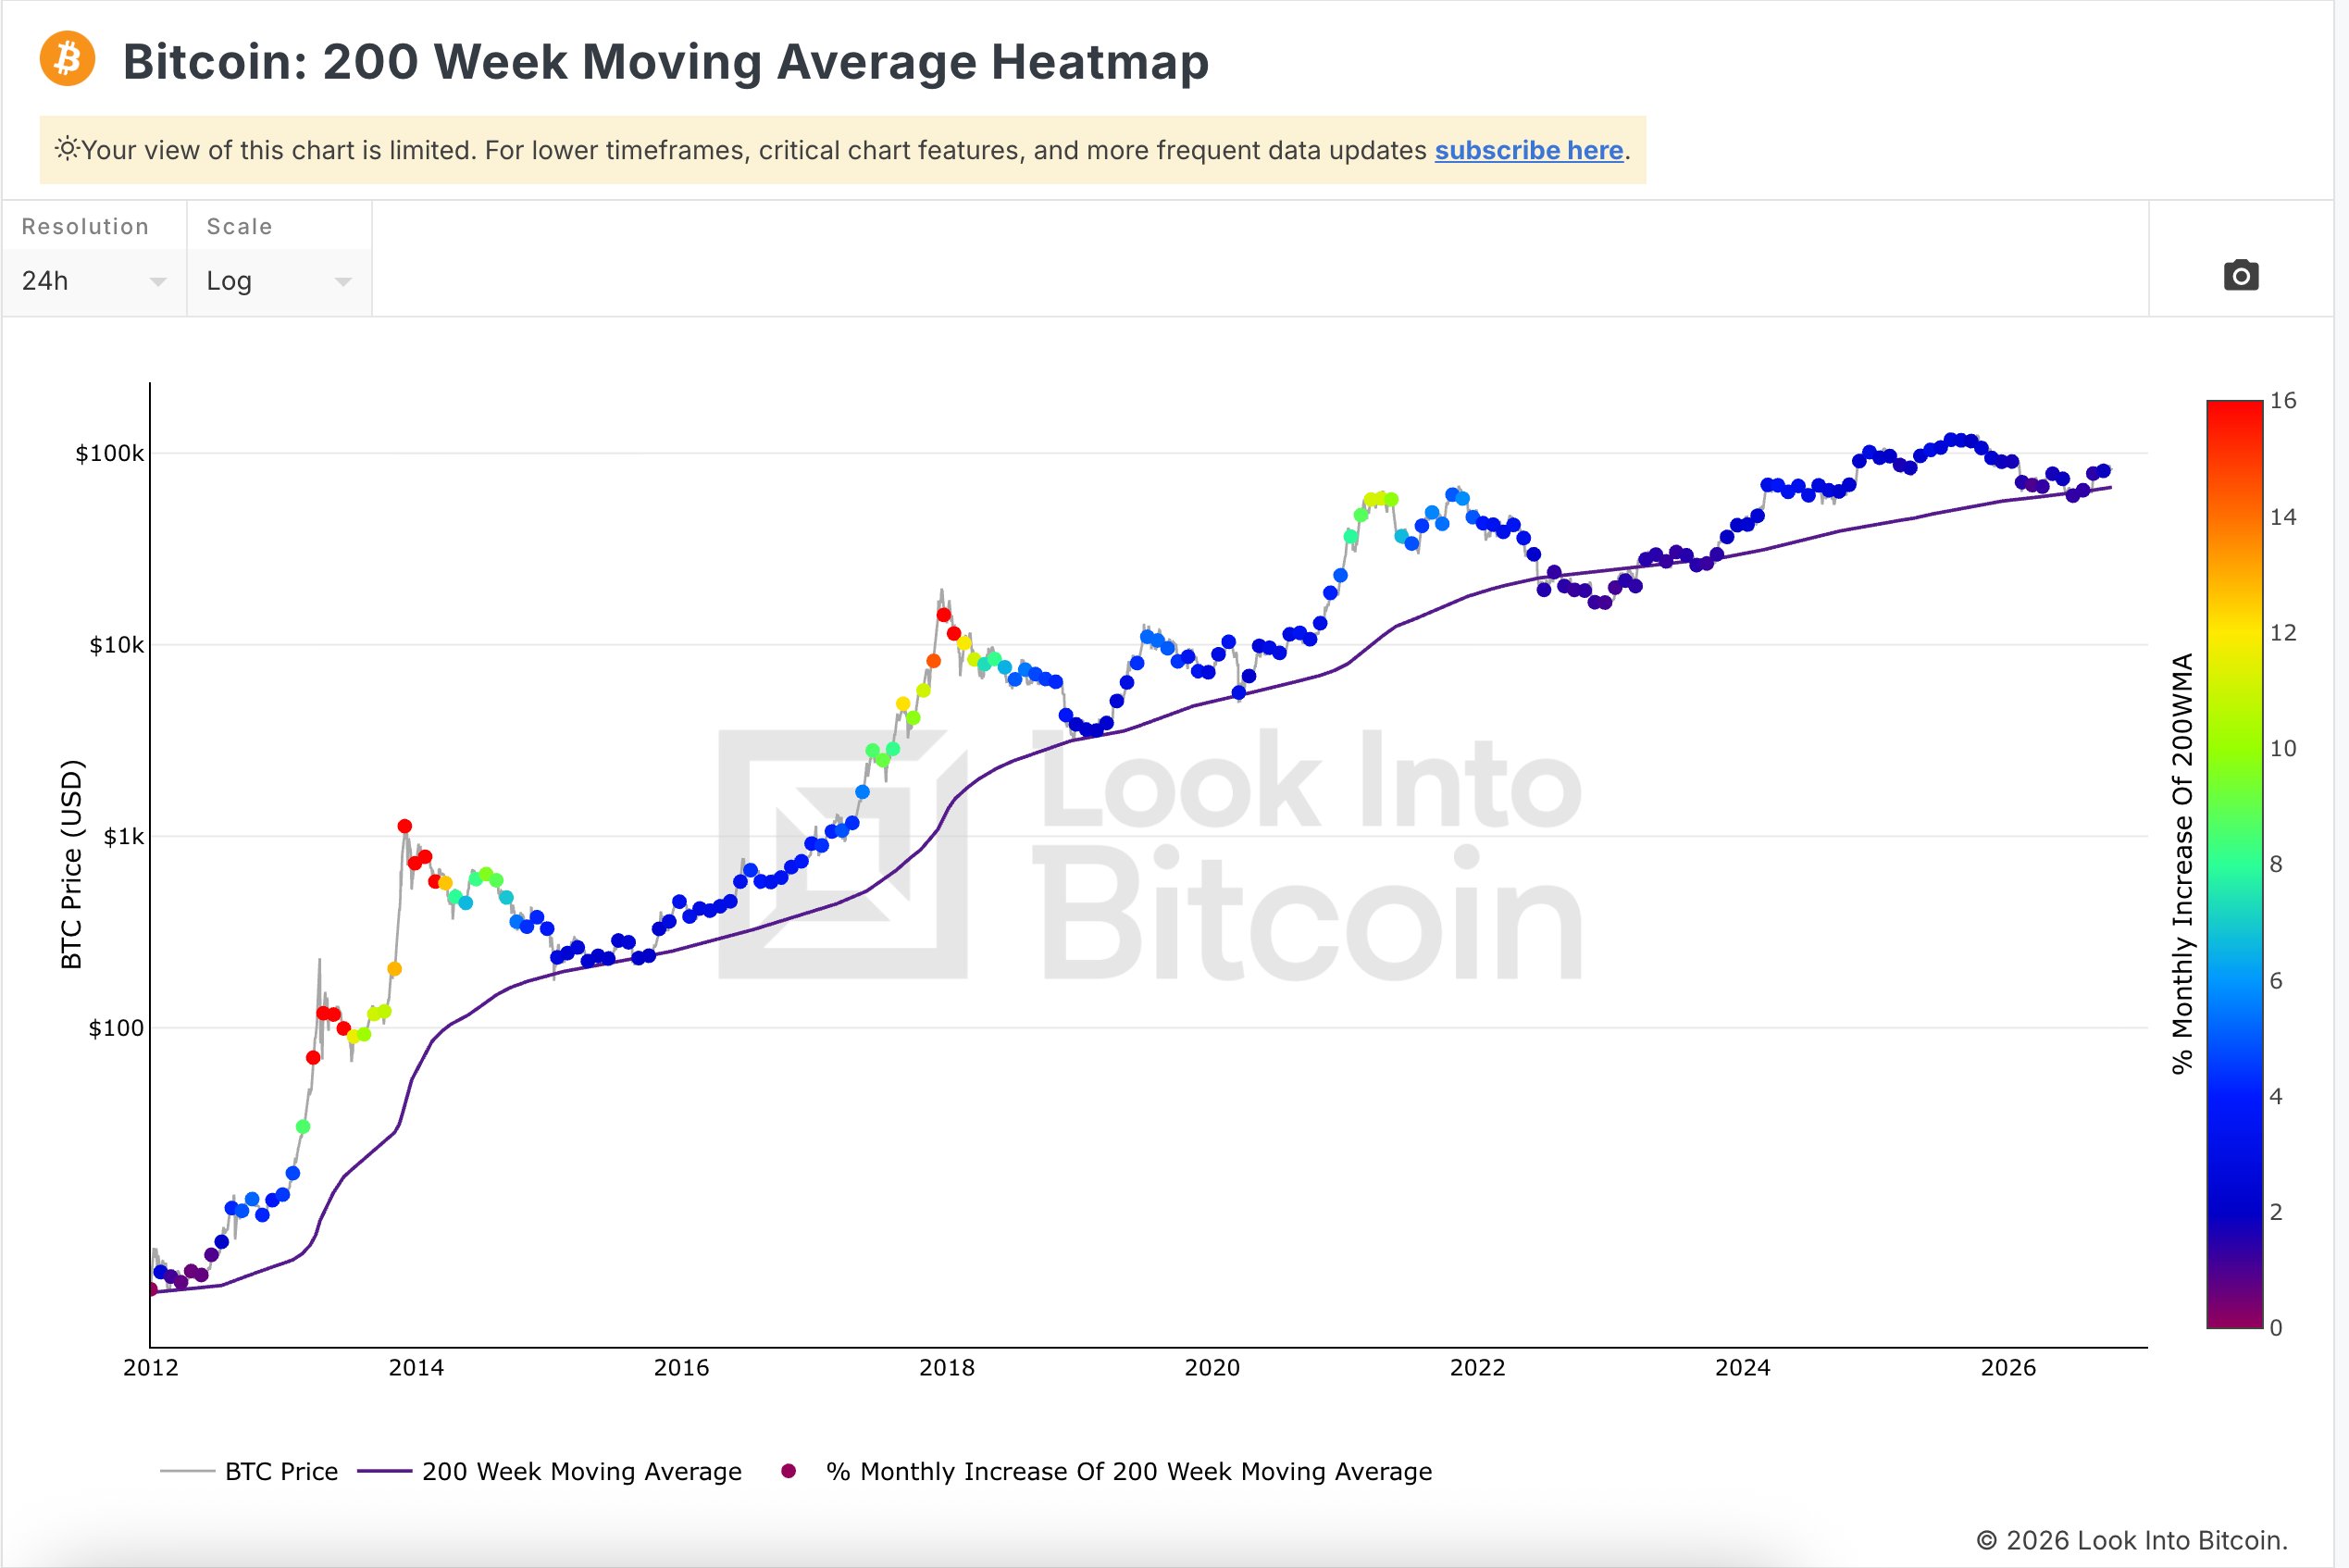
The second independent argument supporting the formation of a global bottom is the 200-week moving average heat map developed by Look Into Bitcoin. This indicator assesses the growth rate of this 4-year support line and colors the chart points with a spectrum from purple to bright red.
The Green Light for “Whales”: Why a Boring Sideways Movement Is Actually the Best Friend of Investors
Throughout the history of Bitcoin, it has only fallen to this level at four key moments, all of which coincided with the most pessimistic market sentiment: in 2015, 2018, 2020, and 2022. Now, the chart indicator has once again turned a cold blue color.
The article states that for the market, this is a major sign of stability, confirming that speculative bubbles and excessive leverage have been completely squeezed out of the system, and panic has given way to calm waiting.
The synchronization signal emitted by Dynamic Rainbow and 200WMA proves that the long-term trend has completely broken away from short-term market noise. The article suggests that while retail investors are feeling exhausted due to the lack of sharp fluctuations, large funds are taking advantage of this period of calmness to create their own advantages.
For investors who adopt the DCA (determined investment) method, the article states that these boring sideways periods, which fall within the “blue” zone, have always been the strongest trigger signals to build positions calmly before the start of a new upward trend.