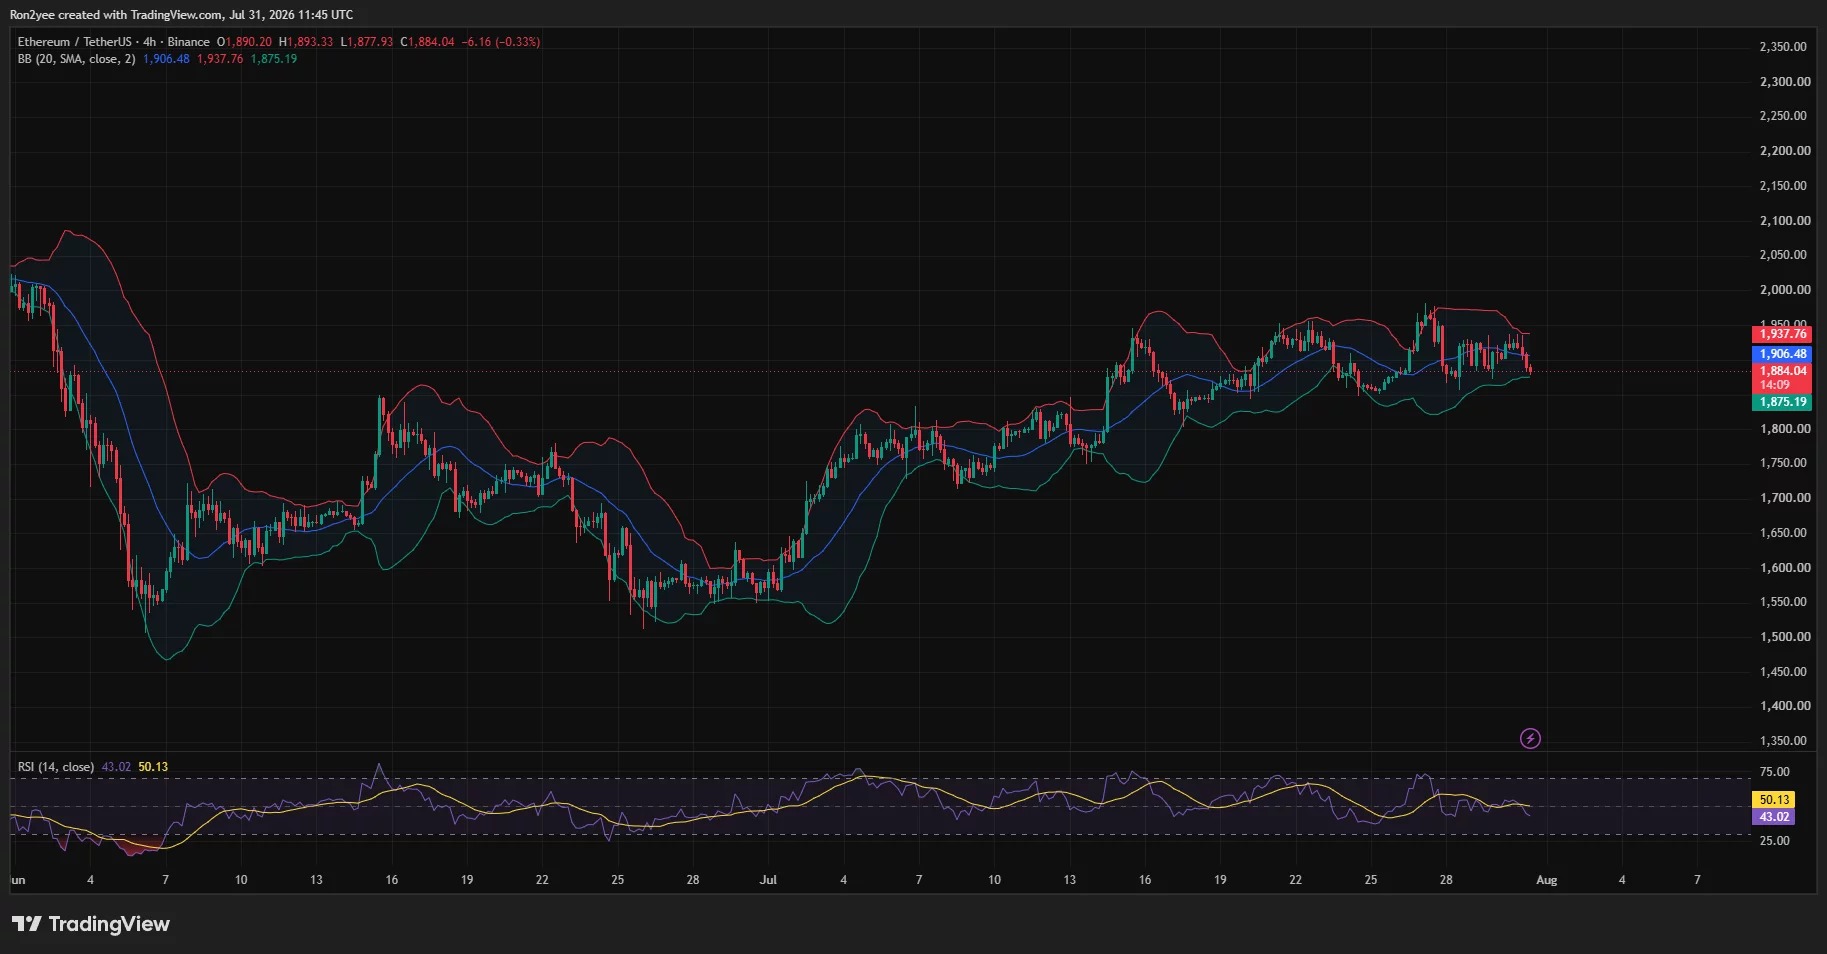


Ethereum continued its decline on July 31, falling to around $1,883 during the session, a single-day drop of nearly 2%. Previous attempts to break through $2,000 failed, weakening short-term buying interest and pushing the price back to the lower end of its trading range.
Selling pressure remains above $1900
Looking at the intraday price action, ETH rose to $1936 before falling back to around $1878, indicating that selling pressure above $1900 remains significant. On the 4-hour chart, the price has broken below the Bollinger Band middle line at $1906 and is approaching the lower line at $1875.
Short-term momentum is also weakening. The 4-hour RSI has dropped to 43.02, below its moving average, indicating that sellers are temporarily in control, but it has not yet entered the extreme oversold zone.
$1873 to $1875 becomes the first support level
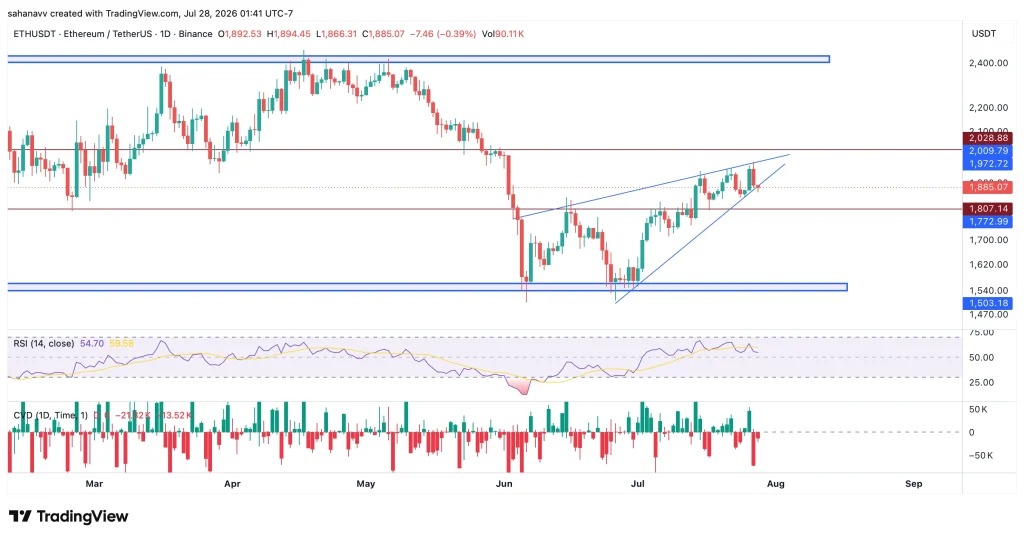
The market is currently focusing on the $1873-$1875 area. The daily 0.618 Fibonacci retracement level is at $1873.5, and the 4-hour Bollinger Band lower rail is at $1875.19. The overlap of these two levels makes this area a key short-term support.
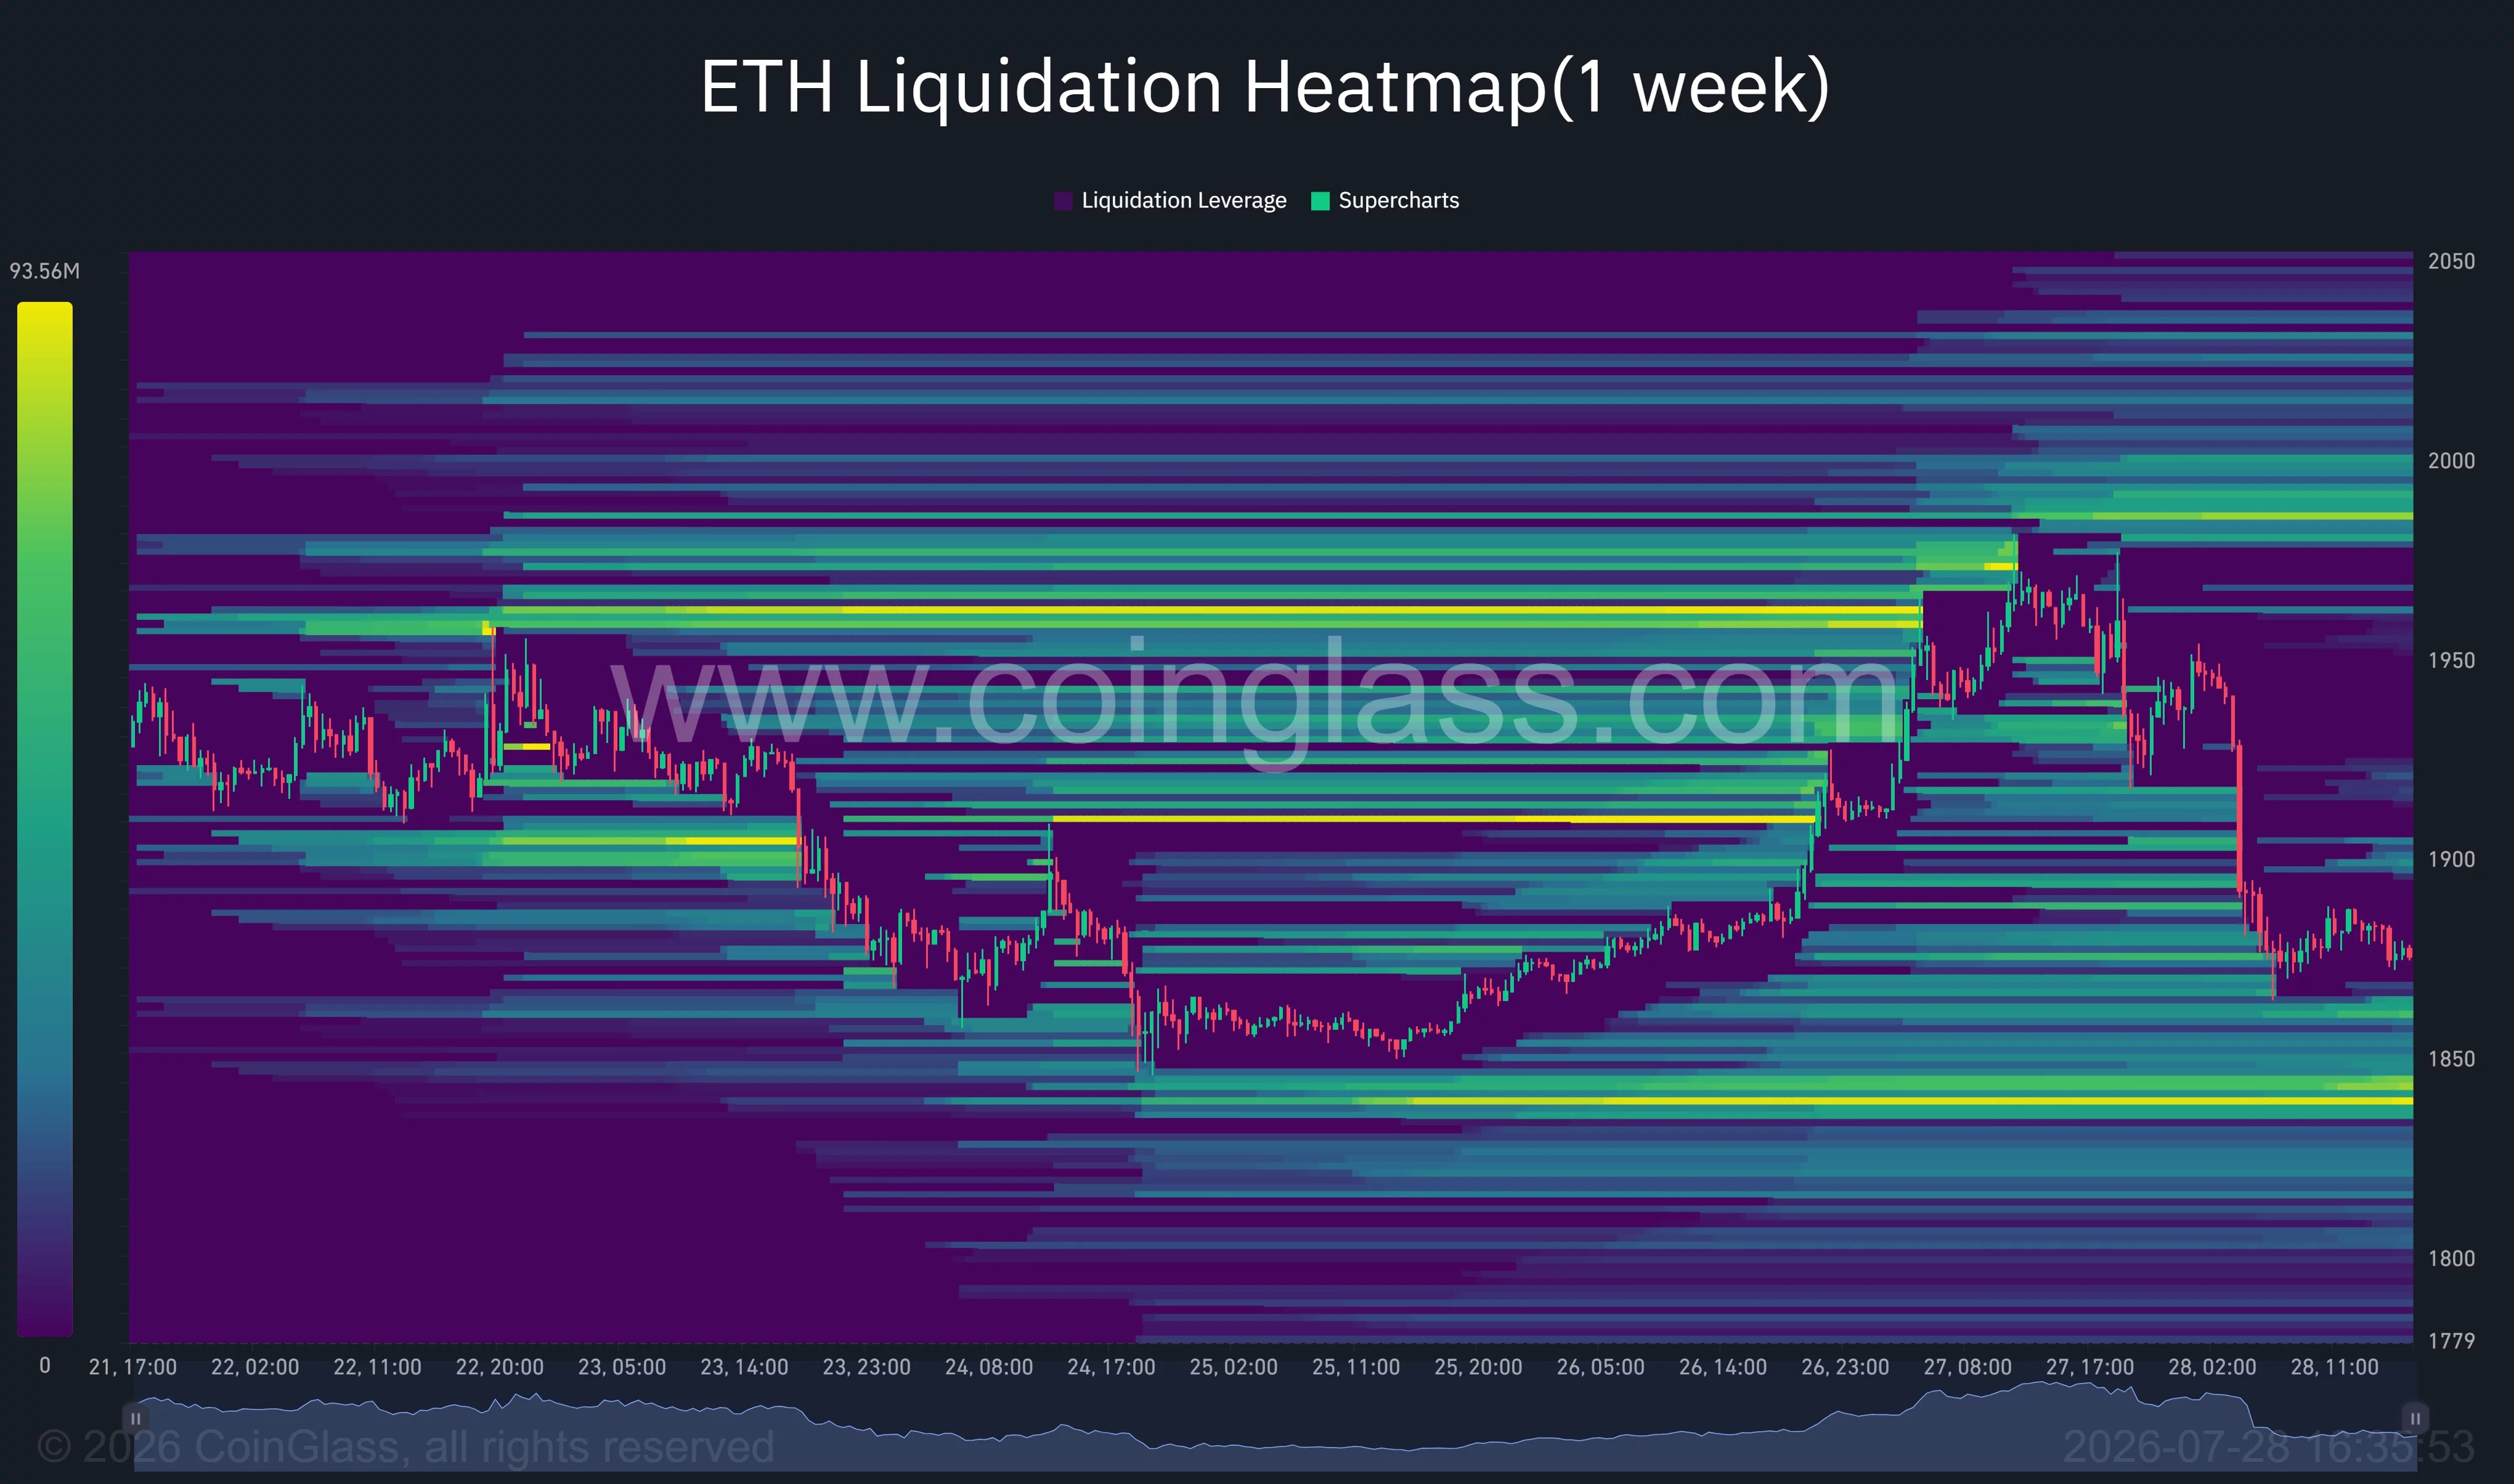
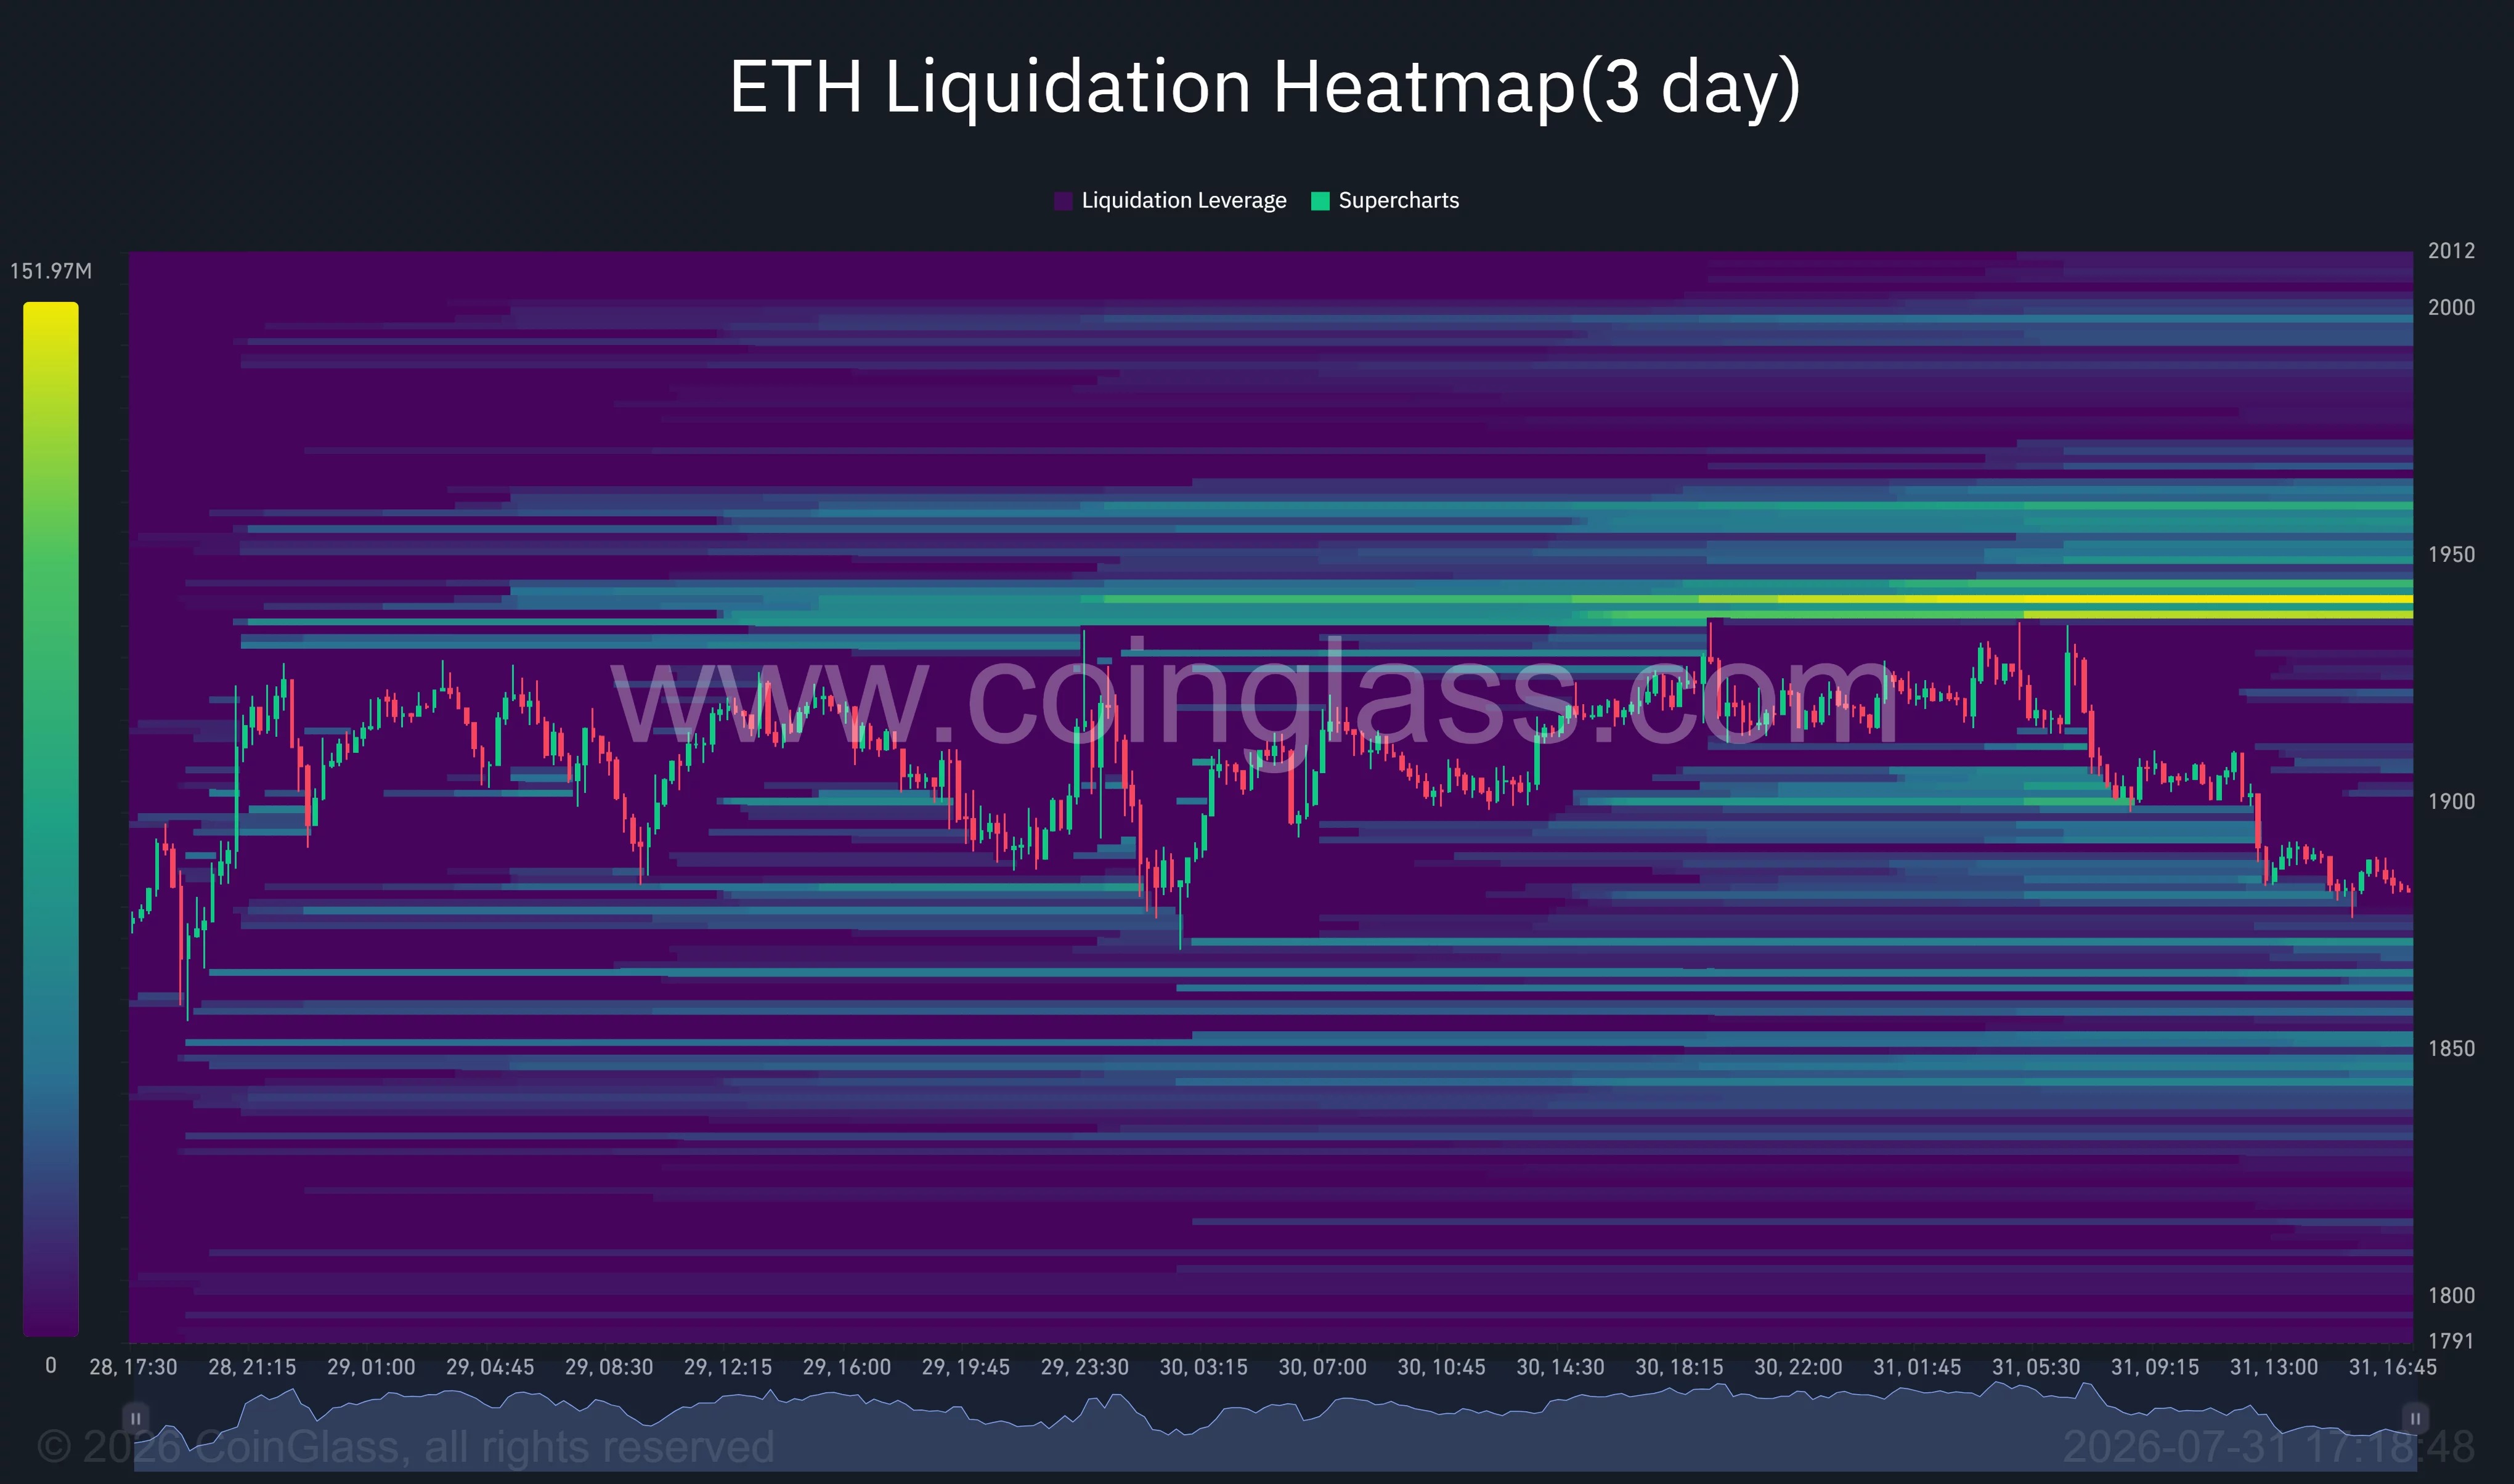
If the daily closing price falls below $1873, the recovery trend that began at the end of June will face further pressure. According to CoinGlass's 3-day liquidation heatmap, there is still considerable liquidity between $1850 and $1870, which could become the next area for further decline.
If $1850 is also breached, market attention may shift to $1800. Looking further down, the 0.786 Fibonacci retracement level is at $1712.86, but this would require a more significant pullback to reach.
Derivative positions widened the decline.
The immediate context of this decline is that ETH saw profit-taking around $1950, while the $2000 level continued to act as resistance. The 50% Fibonacci retracement level on the daily chart is at $1986.33, which is also close to this resistance zone, prompting some short-term funds to reduce their positions.
Derivative positions amplified the pullback. The article cites CoinGlass data, stating that after falling from around $1920, ETH crossed the liquidity zone around $1900 and continued its slide towards above $1880. This put pressure on some leveraged long positions betting on a rapid break above $2000, and liquidation further accelerated the decline.
Beyond the technical factors, the macroeconomic environment has not improved significantly. The Federal Reserve's maintenance of high interest rates keeps the financing environment for risky assets tight; uncertainty in the Middle East also makes market risk appetite cautious. At the same time, Ethereum spot demand remains weak, on-chain activity is low, and redemptions in the spot Ethereum ETF have weakened buying support.
The $1935-$1940 range is a resistance zone for any rebound.
If ETH stabilizes in the current area, the $1935-$1940 range will be the first resistance level it faces during a rebound. The liquidation heatmap shows a significant concentration of leveraged positions in this area, which may attract price rallies.
From a technical perspective, if the price first recovers to $1906, which is the Bollinger Band middle line, it indicates that short-term momentum is beginning to recover. The next resistance level is around $1938, which is close to the upper Bollinger Band and coincides with a major consolidation zone. A further break above this level would allow the market to potentially retest $1986 and $2000.
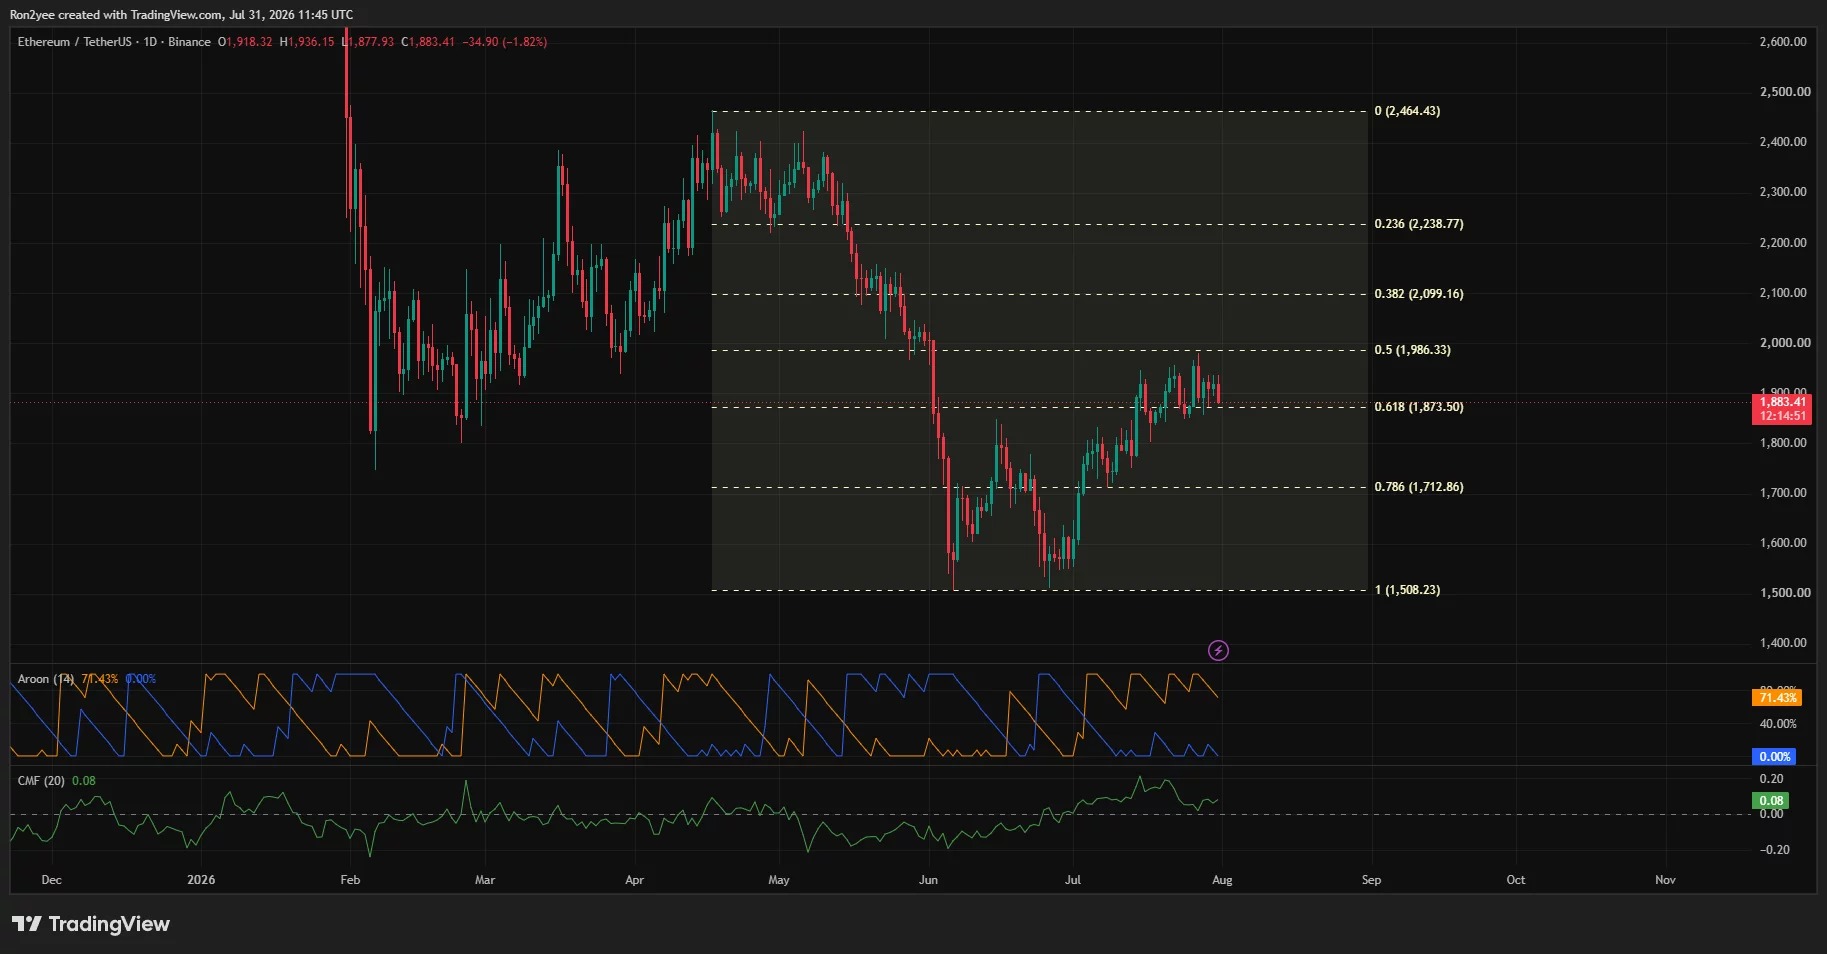
Some medium-term indicators have not yet fully turned bearish. The daily Chaikin Money Flow is 0.08, indicating that the money flow is still slightly positive; the Aroon Up is 71.43 and the Aroon Down is 0, suggesting that the recovery trend since July has not been completely broken. However, this contrasts with the weakness of the 4-hour RSI, meaning that the medium-term structure is still intact, but the short-term dominance is temporarily biased towards sellers.